Solutions · Sustainability & ESG
Sludge Dewatering & Volume Reduction: fewer truckloads, lower scope-3 hauling carbon
Mechanical thickening, polymer discipline, and cake dryness targets—tonnes avoided on the road.
Use this guide within its scope
This page supports technical research and option comparison and is marked 2026. Illustrative values are not a quotation, completed process design, certification conclusion, or performance guarantee. Check current regulations, feed data, tests, and OEM records.
Problem
Wet cake means diesel trucks move mostly water.
Technology
Press/belt/centrifuge selection with polymer optimization and mass tracking.
Results
Measurable haulage reduction and lower disposal fees.
Engineering decision card
Use when
Wet cake means diesel trucks move mostly water.
Evaluate first
Press/belt/centrifuge selection with polymer optimization and mass tracking.
Inputs still required
Feed source and variability, capacity, target quality, operating hours, discharge or reuse boundary, available space, and utilities.
Comparison output
Measurable haulage reduction and lower disposal fees. The final decision still needs feed data, mass balance, and any necessary testing.
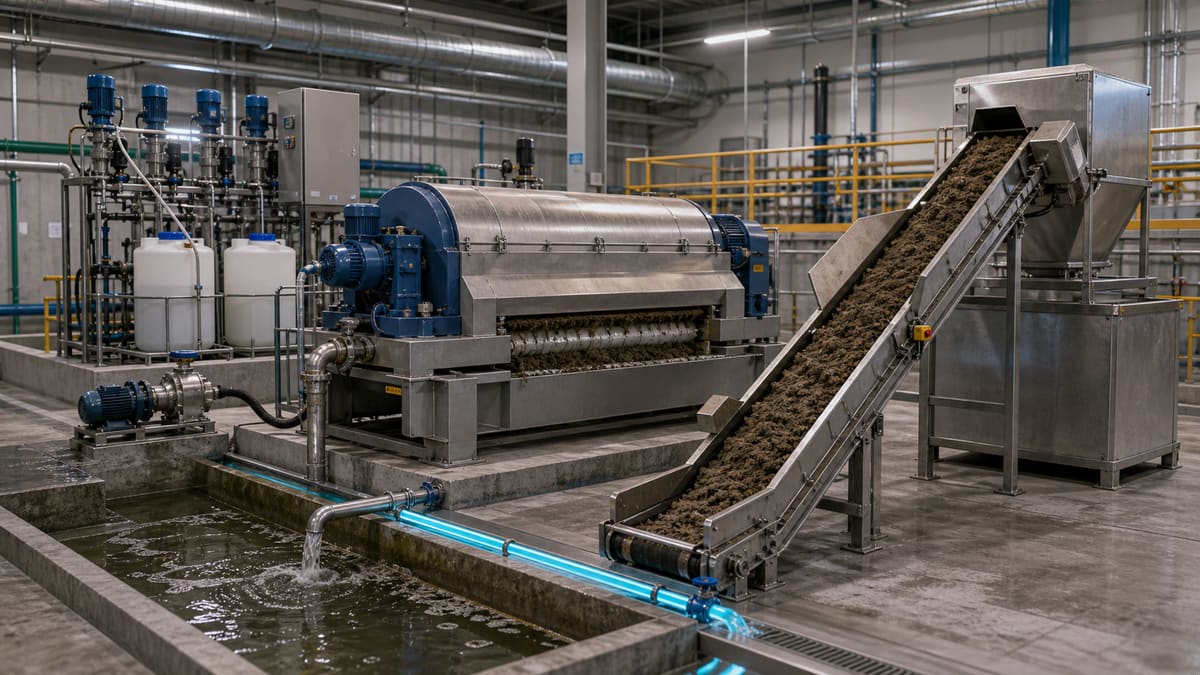
Sludge Dewatering & Volume Reduction: fewer truckloads, lower scope-3 hauling carbon
Industrial wastewater treatment inevitably produces sludge, a byproduct rich in water but often contaminated with solids. Historically, managing this sludge has been a significant operational cost, driven by its sheer volume and the energy required for its transport to off-site disposal facilities. In the context of 2026, with increasing scrutiny from international industrial buyers, EPCs, and sustainability officers—particularly within the UK and EU supply chains—the hidden carbon footprint of sludge disposal is no longer ignorable.
High water content in sludge translates directly into heavy, inefficient truckloads, consuming fossil fuels and driving up Scope 3 emissions, which are increasingly under the microscope for ESG reporting and potentially subject to regulatory pressures. Beyond carbon, inefficient sludge management contributes to overall water risk. When sludge is merely hauled away, the valuable water bound within it is lost to the system, increasing demand on freshwater sources or treatment capacity. this approach's commitment is to enable a green transition, offering robust, data-grounded solutions for sludge dewatering and volume reduction that tackle these challenges head-on, improving your carbon footprint, enhancing water stewardship, and strengthening your position in demanding export markets.
The True Cost of Wet Sludge: Carbon and Resource Inefficiency
The primary objective of sludge dewatering is to remove as much water as possible, concentrating the solids into a smaller, more manageable volume. This reduction directly impacts transportation logistics, disposal costs, and the overall environmental footprint. For industries navigating stringent ESG requirements, especially those supplying into the UK and EU, demonstrating a proactive approach to Scope 3 emissions, particularly from waste logistics, is becoming a non-negotiable aspect of market access and competitive advantage.
Worked energy / carbon sketch
Let's illustrate the carbon savings achievable through effective sludge dewatering with an illustrative back-of-envelope calculation focused on hauling.
Assumptions:
- An industrial facility generates 100 m³ of wet sludge per day at 2% Dry Solids (DS) content.
- Existing disposal involves transporting this sludge off-site to a landfill 50 km away (i.e., 100 km round trip per load).
- A typical sludge truck has a capacity of 20 m³.
- Average diesel consumption for a loaded heavy truck is 35 litres per 100 km.
- The CO₂e emission factor for diesel is 2.6 kg CO₂e per litre.
- The facility operates 300 days per year.
Scenario 1: No Dewatering (2% DS)
- Daily wet sludge volume: 100 m³
- Daily truckloads required: 100 m³ / 20 m³/truck = 5 trucks/day
- Daily distance covered: 5 trucks * 100 km/truck = 500 km/day
- Daily diesel consumption: 500 km * (35 litres / 100 km) = 175 litres/day
- Annual diesel consumption: 175 litres/day * 300 days/year = 52,500 litres/year
- Annual CO₂e emissions: 52,500 litres * 2.6 kg CO₂e/litre = 136,500 kg CO₂e = 136.5 tonnes CO₂e/year
Scenario 2: this approach Dewatering (25% DS)
- Dry solids content: 100 m³ * 0.02 (2% DS) = 2 m³ (or 2 tonnes, assuming density ~1000 kg/m³)
- After dewatering to 25% DS, the solids mass remains 2 m³ (or 2 tonnes).
- New wet sludge volume: 2 m³ DS / 0.25 (25% DS) = 8 m³ wet sludge/day
- Daily truckloads required: 8 m³ / 20 m³/truck = 0.4 trucks/day (or 2 trucks every 5 days)
- Annual truckloads: 0.4 trucks/day * 300 days/year = 120 trucks/year
- Annual distance covered: 120 trucks * 100 km/truck = 12,000 km/year
- Annual diesel consumption: 12,000 km * (35 litres / 100 km) = 4,200 litres/year
- Annual CO₂e emissions: 4,200 litres * 2.6 kg CO₂e/litre = 10,920 kg CO₂e = 10.92 tonnes CO₂e/year
Annual Carbon Reduction:
- 136.5 tonnes CO₂e (without dewatering) - 10.92 tonnes CO₂e (with dewatering) = 125.58 tonnes CO₂e saved per year.
This illustrative calculation clearly demonstrates that improving sludge dry solids content from 2% to 25% can lead to a significant 92% reduction in Scope 3 hauling emissions, translating to tangible environmental and economic benefits.
Traditional vs engineering evaluation path
| Topic | Wet cake / basic mechanical | High-solids dewatering (engineering evaluation path) |
|---|---|---|
| Scope 3 | Many truckloads of water masquerading as sludge. | Fewer rotations per tonne DS; diesel drops with %DS. |
| Cost | Pay per wet tonne; storage smells and floorspace. | Polymer discipline + press/centrifuge tuned to ash/organics. |
| ESG | Haulage intensity buried in spreadsheets. | Tonnes DS, km, and litres fuel become audit rows. |
Water Stewardship and Disclosure: Building Trust Through Data
Effective sludge dewatering isn't just about reducing costs and carbon; it's a critical component of robust water stewardship and transparency for ESG reporting. By reducing the water content in sludge, you are effectively recovering a portion of water that would otherwise be lost to disposal. This recovered water, once treated, can be reused in non-potable applications, reducing your overall freshwater intake and enhancing your water circularity.
FAQ
Q1: What are the primary benefits of advanced sludge dewatering for my business? A1: Advanced dewatering significantly reduces sludge volume and weight, leading to substantial savings on transport and disposal costs. It lowers your Scope 3 carbon emissions, enhances water recovery, reduces operational complexity, and helps meet stringent ESG reporting requirements, making your supply chain more resilient and sustainable.
Q3: Can dewatered sludge be reused or valorized? A3: Absolutely. Sludge dewatered to a high dry solids content opens up more possibilities for beneficial reuse or valorization. Depending on its composition, it can be used as a soil amendment, an energy source (e.g., in incineration or gasification for energy recovery), or for phosphorus recovery. High-quality dewatering is the first step towards transforming waste into a resource.
Carbon savings calculator (illustrative)
Estimate annual electricity savings and avoided CO₂e when specific energy improves (e.g. after ERD, VFD tuning, or train optimization). Replace defaults with your meter data and your grid emission factor from your utility or ESG methodology.
ΔkWh/year ≈ Q(m³/h) × hours/year × (kWh/m³before − kWh/m³after) · tCO₂e ≈ ΔkWh × factor / 1000
Δ specific energy: 1.00 kWh/m³
Estimated electricity savings: 800,000 kWh/year
Indicative avoided emissions: 336 tCO₂e/year
Related equipment & product lines
These categories typically support the approach above—open any line to compare brands and models.
- Pumps & PumpingHigh-pressure and process pump solutions for water treatment skids and plants.View category →
- ChemicalsAntiscalants, cleaners, and process chemicals for water treatment operations.View category →
- Replacement Parts / SparesGeneral replacement parts for treatment systems and subassemblies.View category →
For a closer review, use the engineering inquiry form to share feed, capacity, target, and project stage. Submission does not constitute a completed design or performance commitment.