Illustrated guide · Operating diagnostics
How should DO, ORP, MLSS and SVI be interpreted together?
Combine reaction environment, solids inventory and settling with synchronized location, load and effluent evidence.
Direct answer
Direct answer
The four measurements answer different questions. DO (mg/L) is the local, fast net inventory of dissolved oxygen at the probe. ORP (mV) is the combined redox potential of many couples; it continues to change near zero DO and helps track oxic–anoxic–anaerobic transitions, but it is neither a specific concentration nor a universal cross-plant setpoint. MLSS (mg/L) is the mass of all suspended solids in mixed liquor—active cells, inactive organics and inorganics—not a live-biomass reading. SVI (mL/g) equals the 30-minute settled volume SV30 (mL/L) divided by MLSS (g/L), describing settling/compaction under the test method, not clarifier capacity by itself. Align the same time, zone and representative sample: use DO+ORP for environment, MLSS for inventory, SVI/settling curve for separation, then close with ammonia, NOx, effluent TN/TSS, blanket, RAS/WAS, SRT/F:M and microscopy. Low DO plus falling ORP and rising ammonia favors oxygen/load/nitrification limitation; a suitable redox environment with high MLSS, rising SVI and blanket favors inventory or settleability; low MLSS with rising ammonia can indicate inadequate SRT or solids loss even when SVI looks acceptable. Do not collapse the four into one score.
Align four measurement boundaries first
Mixed times, locations and samples manufacture false causality.
Profile DO and ORP by zone
Verify location, cleaning, calibration and flow; check inlet/mid/outlet and depth. One high-DO point cannot exclude a dead zone.
Make MLSS representative
Avoid scum, RAS discharge, walls and chemical points; mix and sample consistently. Pair MLSS with MLVSS and total inventory.
Pair SVI with the same MLSS sample
SVI=SV30/MLSS(g/L). Standardize cylinder, mixing, 30-min timing, temperature and any approved dilution.
Use the plant's healthy baseline
Zone DO/ORP targets and suitable MLSS/SVI depend on process, SRT, load, temperature and clarifier limits.
One process event combines online probes, representative mixed liquor, settling, filtration and microscopy
Immersed DO/ORP probes, a settling cylinder, MLSS filtration and floc microscopy share the basin/clarifier context.
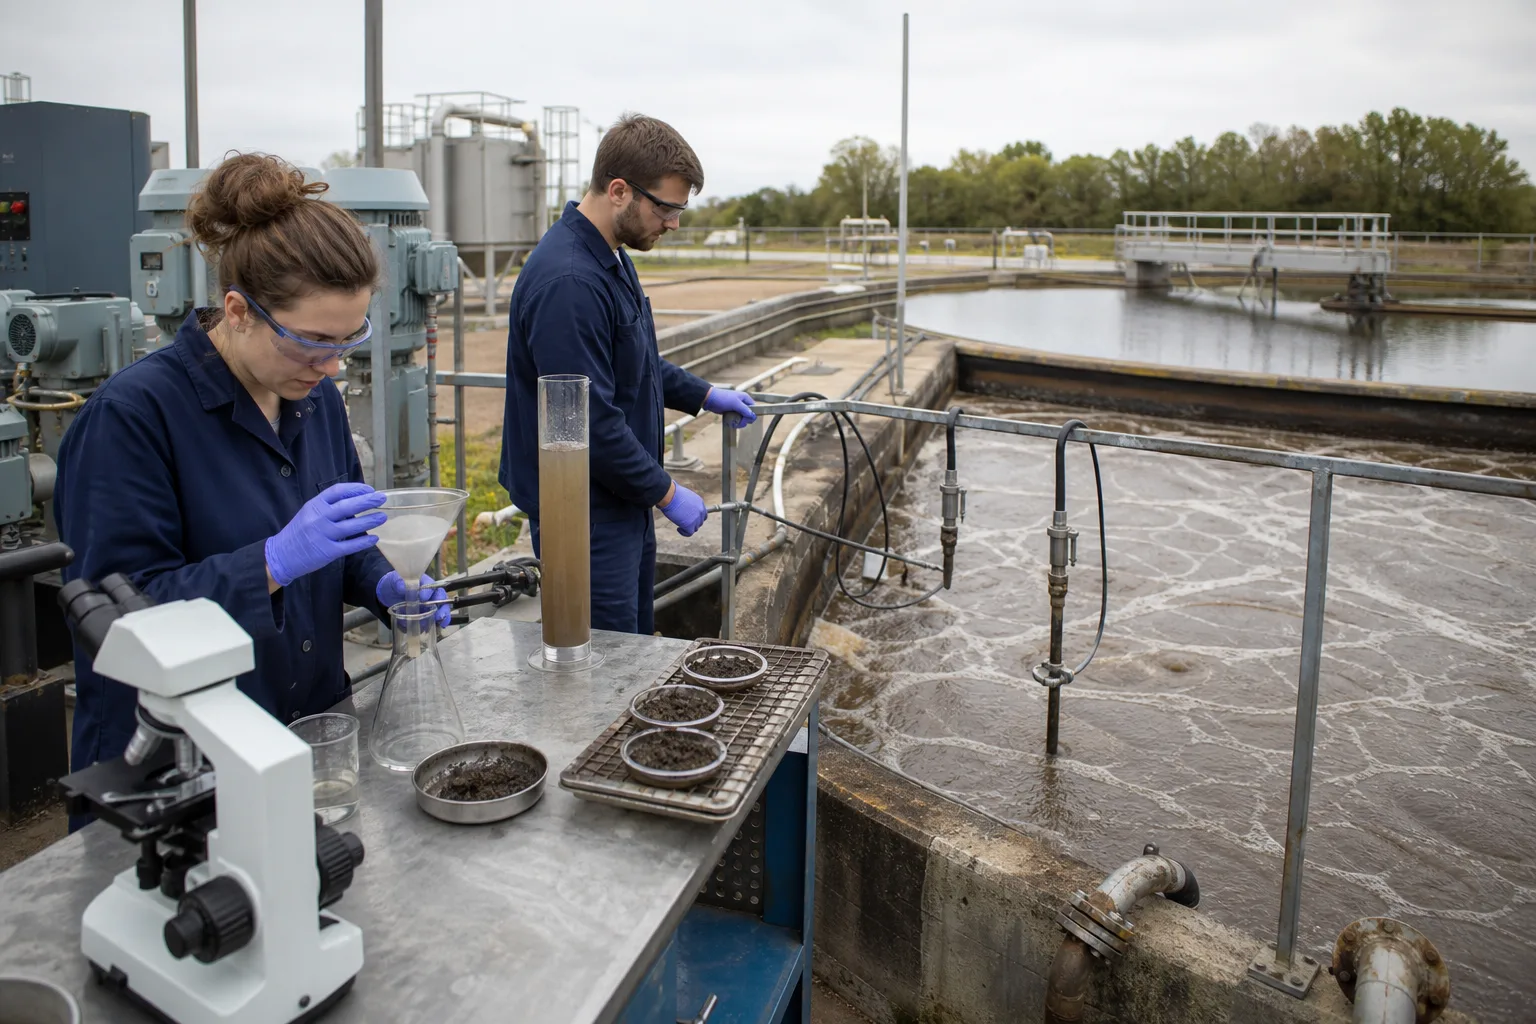 11Basin DO/ORP probes22Same-point, same-time mixed-liquor sample33SV30 interface in settling cylinder44MLSS filtration and microscopy
What to identify
- 1Basin DO/ORP probes
- 2Same-point, same-time mixed-liquor sample
- 3SV30 interface in settling cylinder
- 4MLSS filtration and microscopy
What the image proves
The four indicators are only joint evidence when time and location match.
How to verify it
Use one sampling map/timestamp and record flow/load, aeration, recycle/wasting and weather across a hydraulic residence window.
The bench separates what each measurement actually sees
Electrodes read liquid environment, filter mass gives MLSS, the cylinder gives SV30 and the microscope explains morphology.
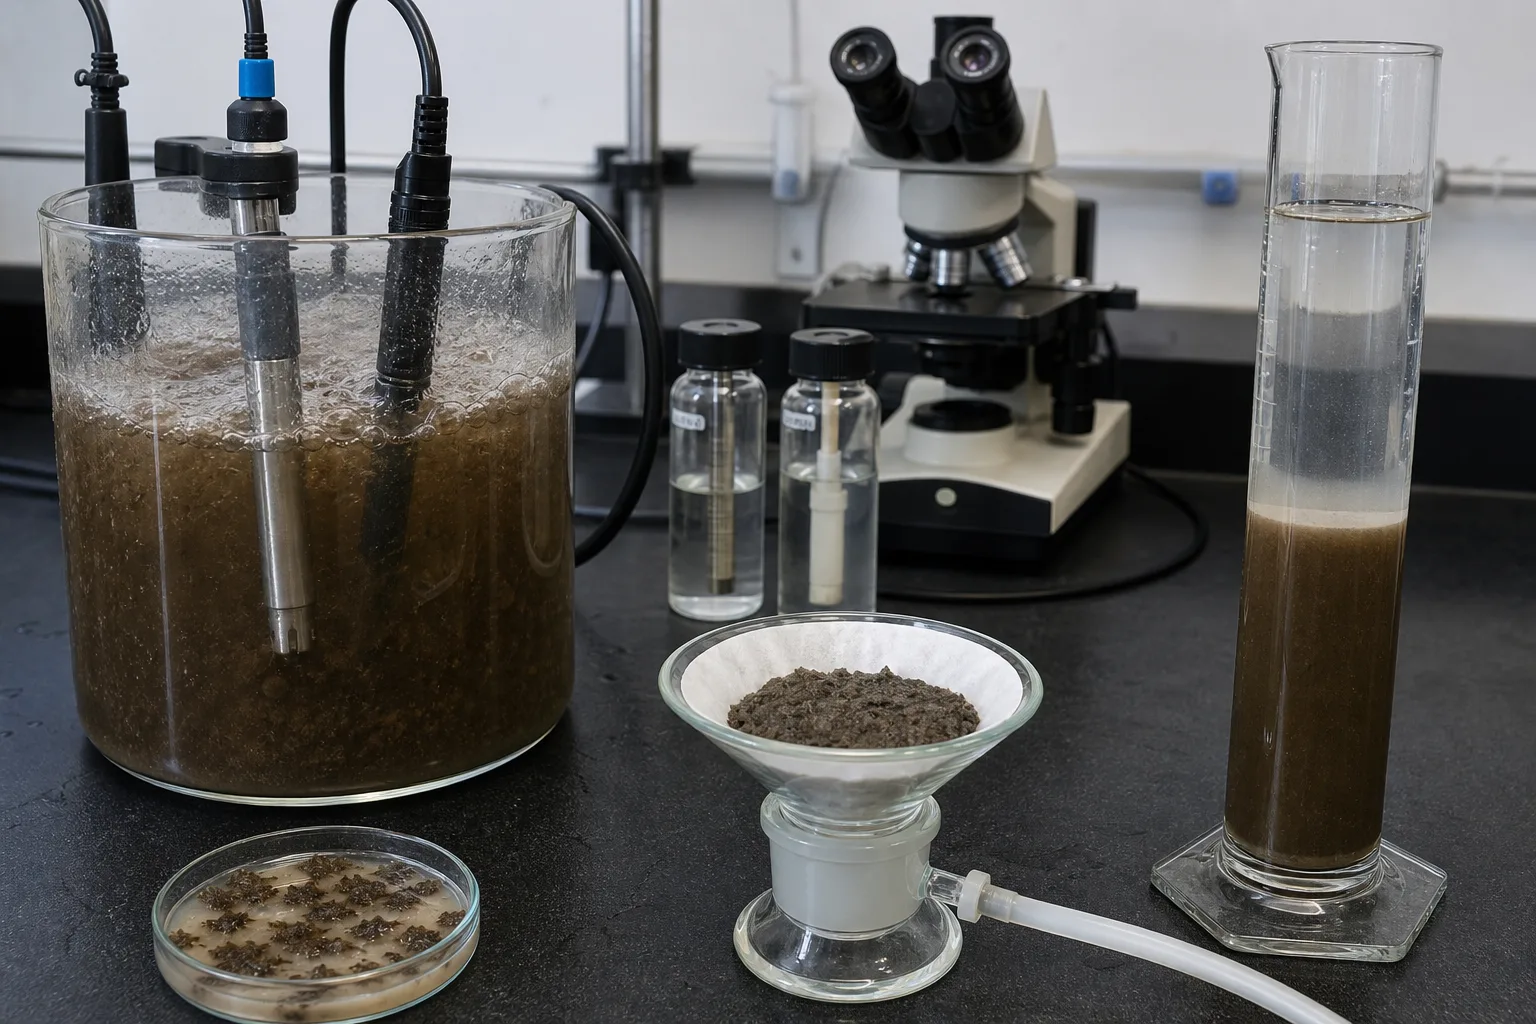 11DO: local dissolved-oxygen concentration22ORP: combined redox potential33Dry filter mass: MLSS4430-min interface: SV30/SVI
What to identify
- 1DO: local dissolved-oxygen concentration
- 2ORP: combined redox potential
- 3Dry filter mass: MLSS
- 430-min interface: SV30/SVI
What the image proves
DO/ORP are electrochemical environment, MLSS is mass and SVI is volume per mass.
How to verify it
QA DO/ORP standards, MLSS blank/constant dry mass and calculate SVI from the same well-mixed sample.
A multi-zone BNR train needs a longitudinal DO–ORP profile
Low-aeration, transition and aerobic zones are sampled with settling/filtration/microscopy while recycle carries solids, nitrate and oxygen.
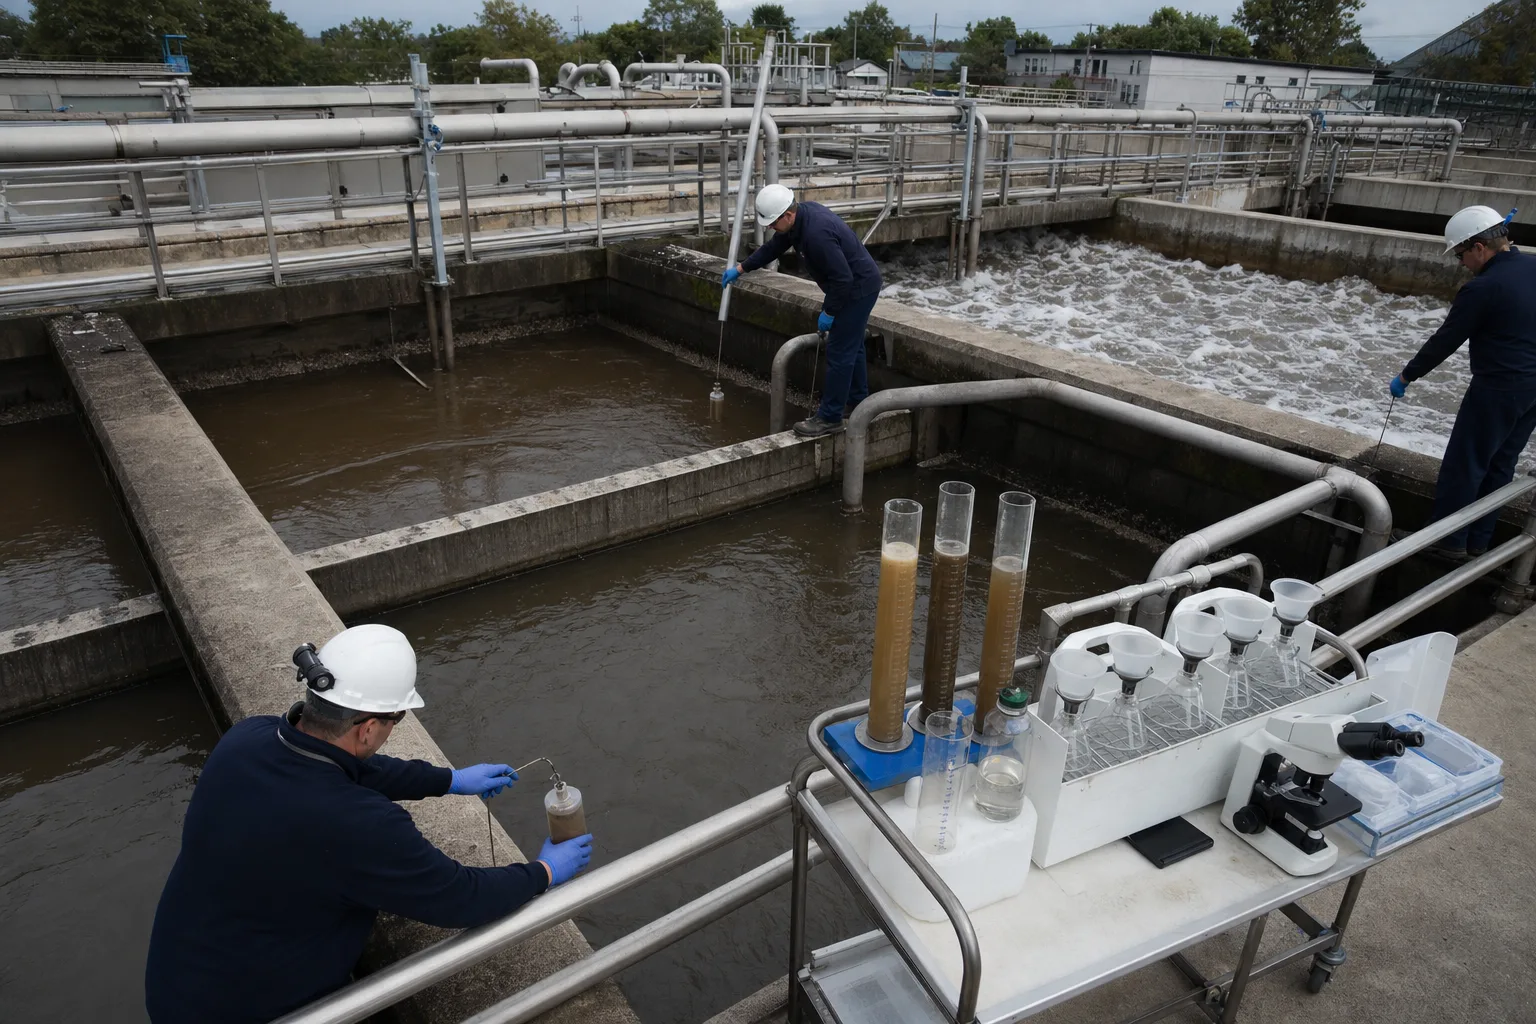 11Anaerobic/anoxic DO–ORP trend22Recycle NOx, DO and mixed solids33Aerobic DO and ammonia endpoint44Zone SV30/MLSS/microscopy
What to identify
- 1Anaerobic/anoxic DO–ORP trend
- 2Recycle NOx, DO and mixed solids
- 3Aerobic DO and ammonia endpoint
- 4Zone SV30/MLSS/microscopy
What the image proves
Low DO/ORP may be correct in the right zone; verify it against nitrogen species and recycle load.
How to verify it
Measure DO, ORP, NH₄, NO₂/NO₃, pH/alkalinity along flow and calibrate plant-specific trends.
Parallel reactors show that the same DO or MLSS can yield different sludge outcomes
Different environments/inventories lead to clear compaction, turbid supernatant, bulking or hindered settling, supported by filters and microscopy.
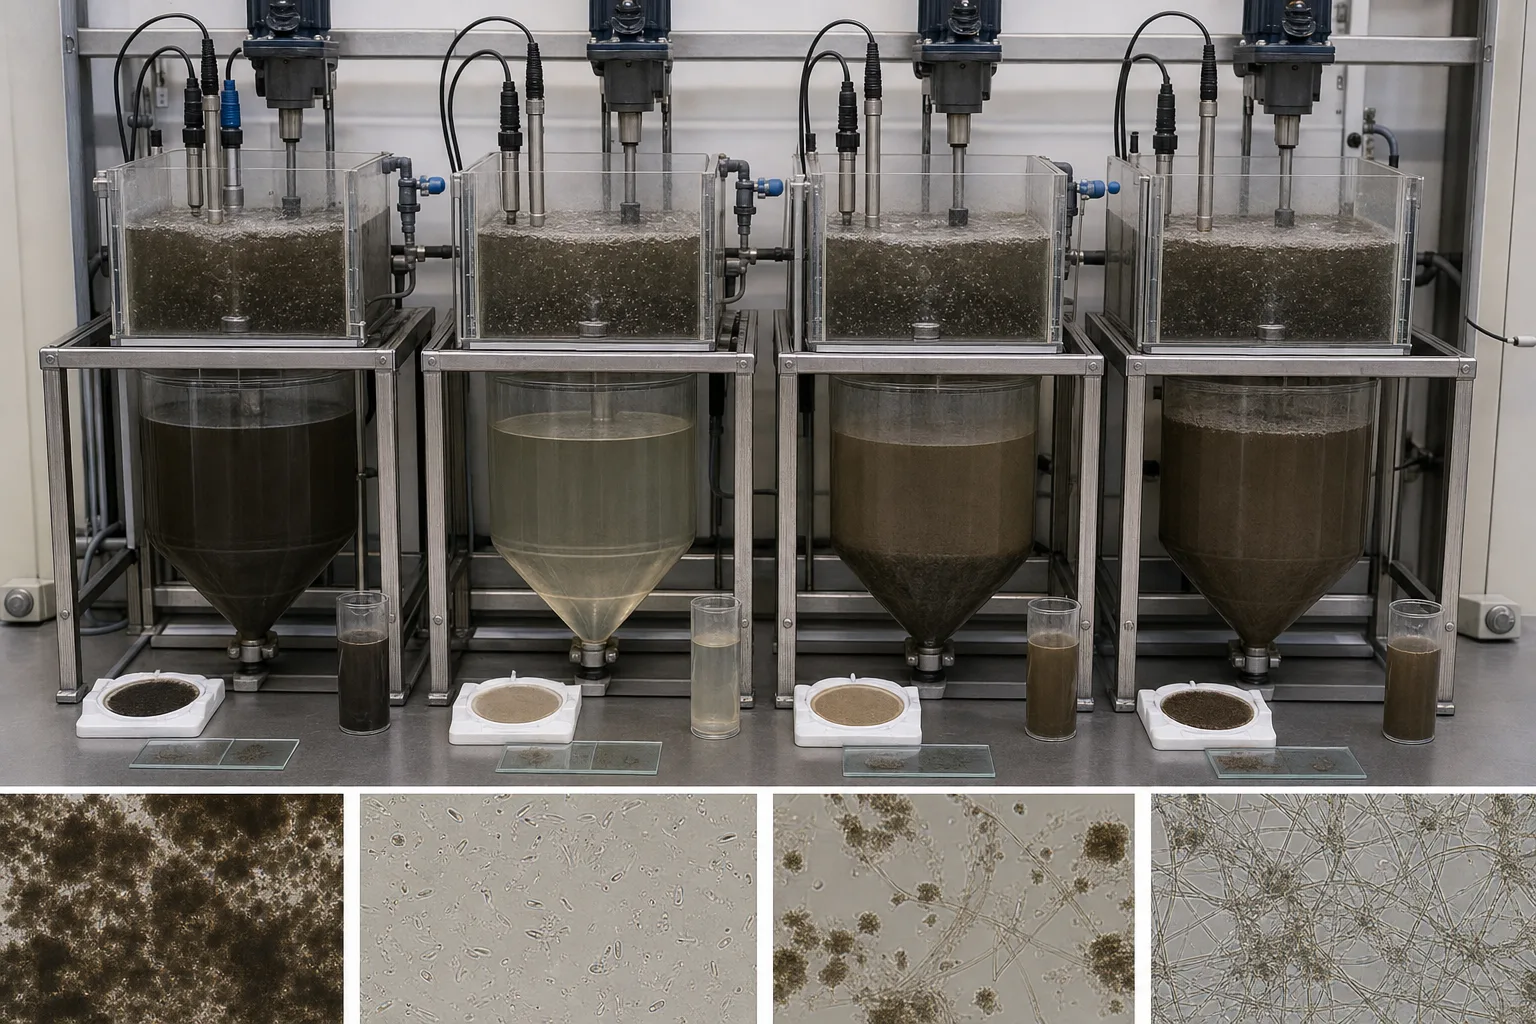 11Different DO/ORP environments22MLSS inventory/filter mass33SV30 compaction and supernatant44Floc, dispersed cells and filaments
What to identify
- 1Different DO/ORP environments
- 2MLSS inventory/filter mass
- 3SV30 compaction and supernatant
- 4Floc, dispersed cells and filaments
What the image proves
High SVI is not one unique bulking cause, and low SVI does not guarantee clear effluent.
How to verify it
Compare 0/5/10/30-min curves, supernatant turbidity, DSVI, microscopy and clarifier solids flux.
Final QA checks probe condition, laboratory repeatability and settling-method consistency
Field placement, cleaning, standards, mixed-liquor checks, filter cakes and cylinder technique expose common errors.
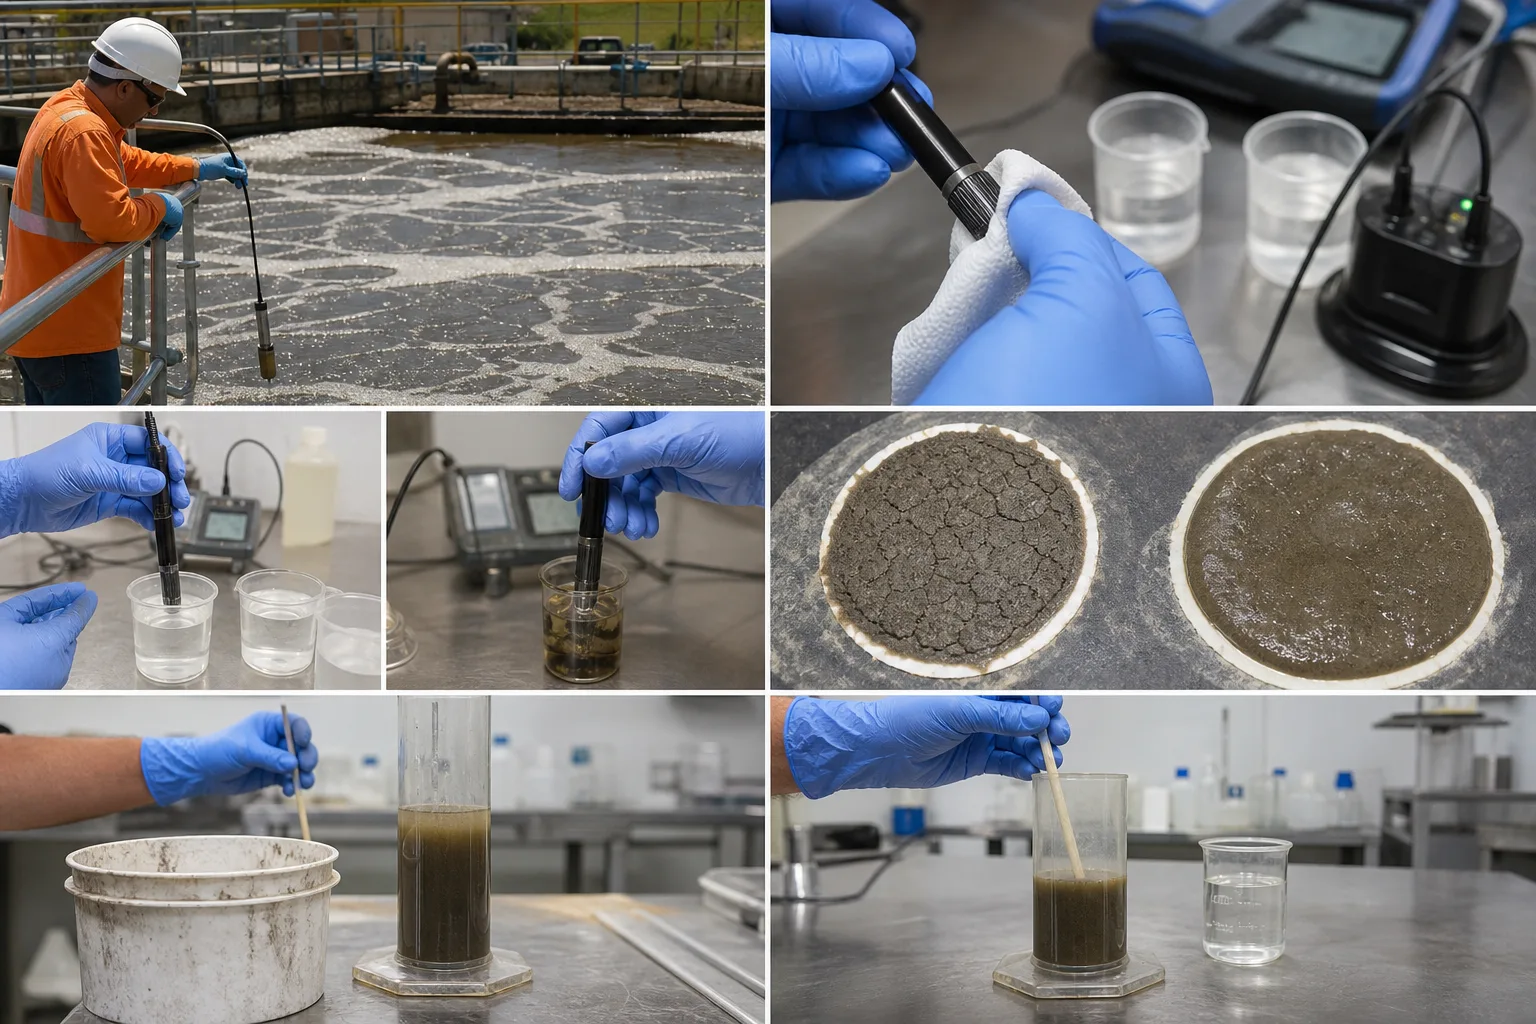 11Probe location, fouling and flow22Cleaning, standard and reference meter33MLSS filter drying/weighing/sample44SV30 cylinder, mixing, timer/interface
What to identify
- 1Probe location, fouling and flow
- 2Cleaning, standard and reference meter
- 3MLSS filter drying/weighing/sample
- 4SV30 cylinder, mixing, timer/interface
What the image proves
When the indicators conflict, prove each number before changing air or wasting.
How to verify it
Trend online–portable–lab bias and document cleaning, filter lot, constant mass, cylinder and operator.
Eight steps from four numbers to action
Validate data, then environment, inventory, settling and treatment result.
1. Align event
Same zone/time + load/aeration/RAS-WAS
Avoid mixing residence times.
2. Validate
Probe QA + MLSS duplicate + standard SV30
Remove measurement error.
3. Environment
DO profile + ORP trend + pH/T
Confirm zones.
4. Biology result
NH₄, NO₂/NO₃, COD/P
Prove the reaction occurred.
5. Inventory
MLSS/MLVSS×volume + solids exits
Calculate SRT/F:M.
6. Settling
SV5–30 + SVI/DSVI + supernatant
Separate settling and compaction.
7. Clarifier
Blanket + hydraulic/solids loading + TSS
Identify separation limit.
8. Adjust/verify
Air/recycle/waste/load → trend
Change one main variable and verify outputs.
What each indicator owns
Respect definitions before combining.
DO (mg/L)
- Direct meaning
- Instant local oxygen inventory from supply minus demand.
- Cannot prove alone
- Whole-basin distribution, oxygen transfer, OUR, biomass or completed nitrification.
- Pair with
- Profile, air/power, OUR/SOUR, ammonia, T and probe QA.
ORP (mV)
- Direct meaning
- Combined electron environment and transition trend.
- Cannot prove alone
- DO replacement, nitrate concentration or universal good/bad value.
- Pair with
- DO, pH/T, NH₄/NOx, zone and reference-electrode condition.
MLSS (mg/L)
- Direct meaning
- All suspended-solids mass concentration used in inventory.
- Cannot prove alone
- Live biomass, activity, SRT, total mass or settleability.
- Pair with
- MLVSS, volume, SRT, F:M and solids mass balance.
SVI (mL/g)
- Direct meaning
- 30-min settled volume per gram under a defined method.
- Cannot prove alone
- Clarifier capacity, filament identity, effluent TSS or solids-flux limit.
- Pair with
- Curve/DSVI, supernatant, microscopy, blanket and clarifier loading.
SVI=SV30 (mL/L) ÷ MLSS (g/L). SV30 300 mL/L and MLSS 3.0 g/L gives 100 mL/g. About 150 mL/g is often a bulking warning, not a universal failure verdict.
Keep four synchronized datasets
Time/space/load
Influent Q/COD/N/P, T, zone/depth, HRT, air/mixing, internal recycle, RAS/WAS.
Environment/result
DO/ORP/pH profile, OUR/SOUR, NH₄, NO₂/NO₃, PO₄ and alkalinity.
Inventory
MLSS/MLVSS, volume, RAS/WAS/effluent solids, SRT, F:M and daily balance.
Separation
SV5/10/30, SVI/DSVI, supernatant, microscopy, blanket, RAS and clarifier loading.
Four diagnostic combinations
- Combined signal
- Aerobic DO low, ORP falls, ammonia rises; MLSS/SVI not first to change
- Likely direction
- Oxygen, load, mixing/transfer or probe location
- First action
- Verify profile/OUR/air, load, diffusers, alkalinity and temperature
- Combined signal
- Environment suitable; MLSS, SVI and blanket rise
- Likely direction
- Excess inventory, SRT/F:M shift or settleability loss
- First action
- Solids balance, microscopy/DSVI and review WAS/RAS/solids flux
- Combined signal
- MLSS low and ammonia rises while SVI looks acceptable
- Likely direction
- Low SRT, solids loss, cold/low alkalinity or toxicity
- First action
- Calculate actual SRT/solids loss and check inhibition
- Combined signal
- SVI not high but effluent TSS and pin floc rise
- Likely direction
- Dispersed/pin floc, poor flocculation or hydraulic shear/shock
- First action
- Inspect supernatant/microscopy, blanket/loading and SRT/F:M
Four common mistakes
Normal DO means normal biology
It is local oxygen inventory; prove outcome with nitrogen, OUR, SRT and profiles.
Higher ORP is always better
Anoxic/anaerobic zones need reducing conditions; use zone purpose and trend.
More MLSS means more capacity
Oxygen, substrate, SRT and clarifier solids flux impose limits.
High SVI means filaments; low means safe
Hindered settling raises SVI, while pin floc may show low SVI and turbid effluent.