Illustrated guides · Disinfection, oxidation, and micropollutants
Why can activated carbon adsorb odors and micropollutants?
Activated carbon concentrates selected dissolved organics at a vast internal solid-water interface; pore structure, compound properties, natural-organic-matter competition, hydraulics, and breakthrough govern performance.
Direct answer
Direct answer
Activated carbon does not make pollutants disappear into a black particle. A dissolved molecule crosses the external liquid film, diffuses through macro- and mesopores, and reaches internal surfaces—especially micropores—where dispersion forces, hydrophobic and π interactions, electrostatics, hydrogen bonding, or stronger surface reactions can retain it. Carbon made from coal, coconut shell, wood, peat, or other feedstocks has different pore-size distributions and surface chemistry, so capacity and rate depend on molecular size, shape, solubility, charge, concentration, pH, temperature, particle size, and contact. Natural organic matter is usually much more concentrated than trace targets and can compete, preload the bed, or block pores. Color or odor improvement therefore cannot prove that every micropollutant is controlled. In a GAC fixed bed, a mass-transfer zone moves from inlet to outlet: carbon behind it becomes loaded while carbon ahead remains fresher. Breakthrough begins as the target front approaches the outlet. Empty-bed contact time (EBCT = media volume / flow) is a design comparison, not the residence time of every parcel and not unlimited capacity. Backwashing removes captured solids and restores hydraulics; it does not regenerate occupied adsorption sites. Exhausted carbon must be replaced or reactivated. A mature bed may also become biologically active carbon (BAC), whose biodegradation must be evaluated separately from adsorption.
Four conditions make carbon useful for a target
A black bed only proves that media is present, not that the target reached suitable pores with enough time and remaining capacity.
Match pores and surface to the molecule
Micropores provide much of the area; meso- and macropores provide transport. Inaccessible pores or mismatched surface chemistry reduce useful capacity.
Provide contact and even hydraulics
Flow, bed depth, particle size, temperature, and channeling control diffusion. Confirm EBCT choices with real-water pilot, RSSCT, or credible breakthrough data.
Account for competitors and preloading
NOM, co-contaminants, and upstream oxidation products compete or block access. Source-water changes can sharply shift carbon life.
Define life by target breakthrough
Clear water, no odor, or normal headloss cannot replace target analysis. Set changeout on the earliest risk-relevant breakthrough.
A full-scale GAC filter combines adsorption, particle capture, and periodic backwash
The dark foreground bed is online, a middle cell is expanded by air-water backwash, wash troughs collect waste, and instruments isolate and sample each cell.
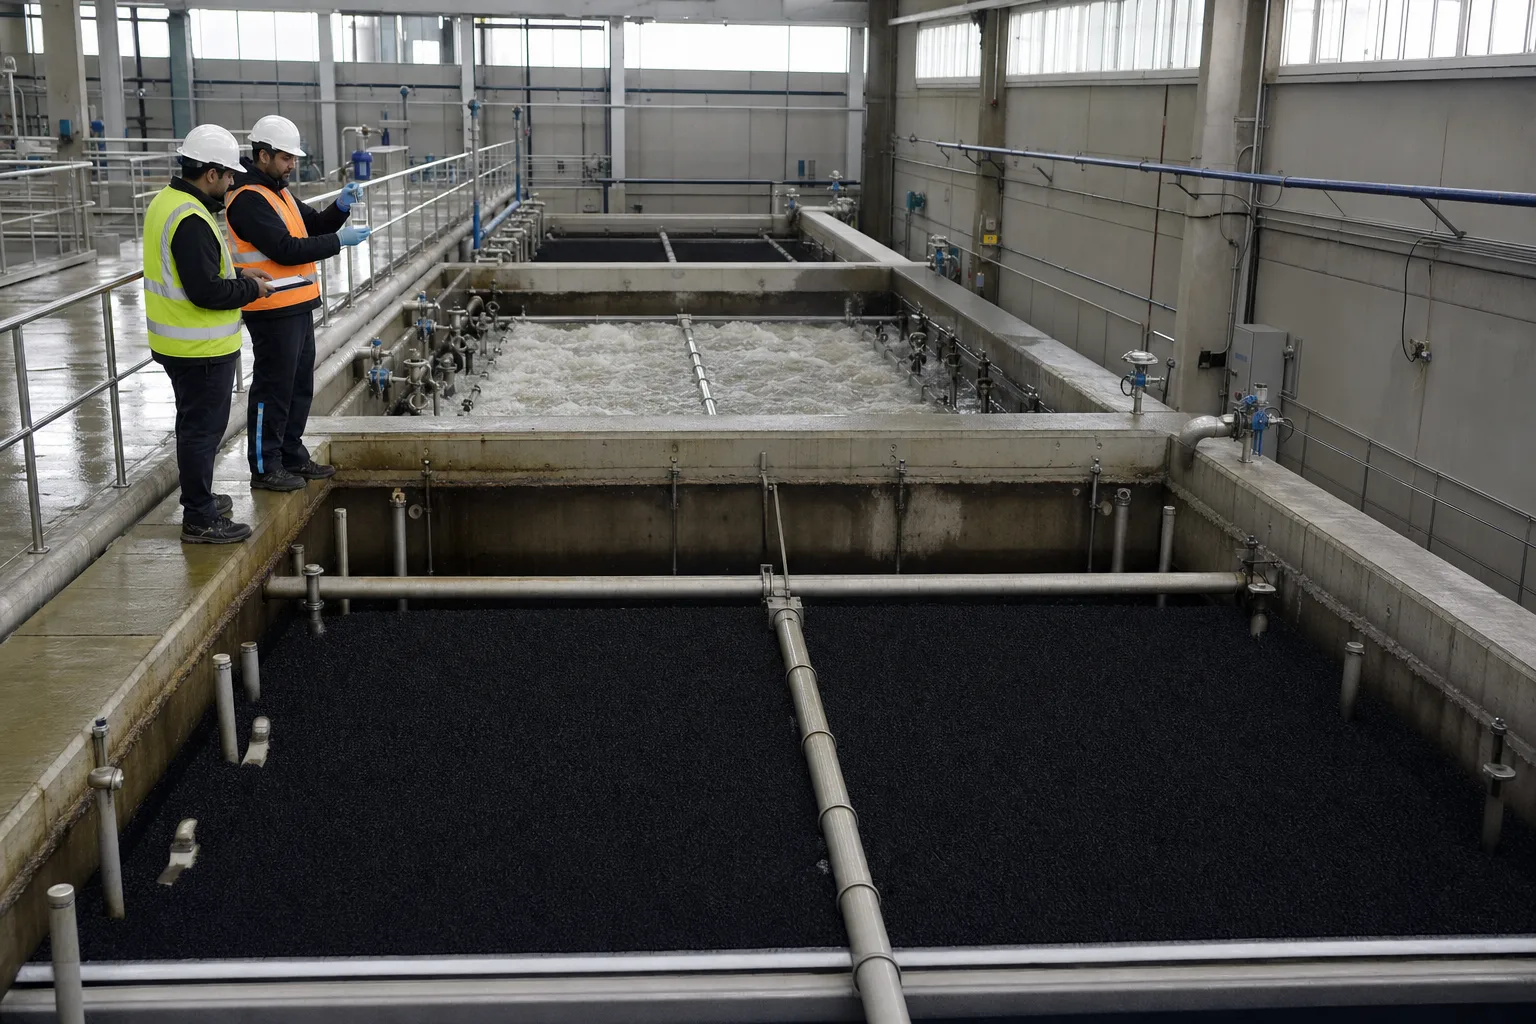 11Online GAC adsorption/filter bed22Air-water expanded backwash bed33Wash troughs and even withdrawal44Headloss, sampling, and cell isolation
What to identify
- 1Online GAC adsorption/filter bed
- 2Air-water expanded backwash bed
- 3Wash troughs and even withdrawal
- 4Headloss, sampling, and cell isolation
Figure takeaway
A GAC bed can adsorb dissolved targets, capture solids, and develop biological activity. Backwash restores void space and hydraulic distribution; it does not restore adsorption capacity already consumed.
How to verify it in the field
Trend cell flow, bed depth, EBCT, targets/NOM, headloss, and backwash. Verify expansion, wash turbidity recovery, carbon/fines loss, and post-backwash water quality.
A laboratory column links the visible grain, hidden pore network, and before-after samples
A small GAC bed treats water beside raw/treated cuvettes; wet granules and a magnified porous surface show that most area is internal.
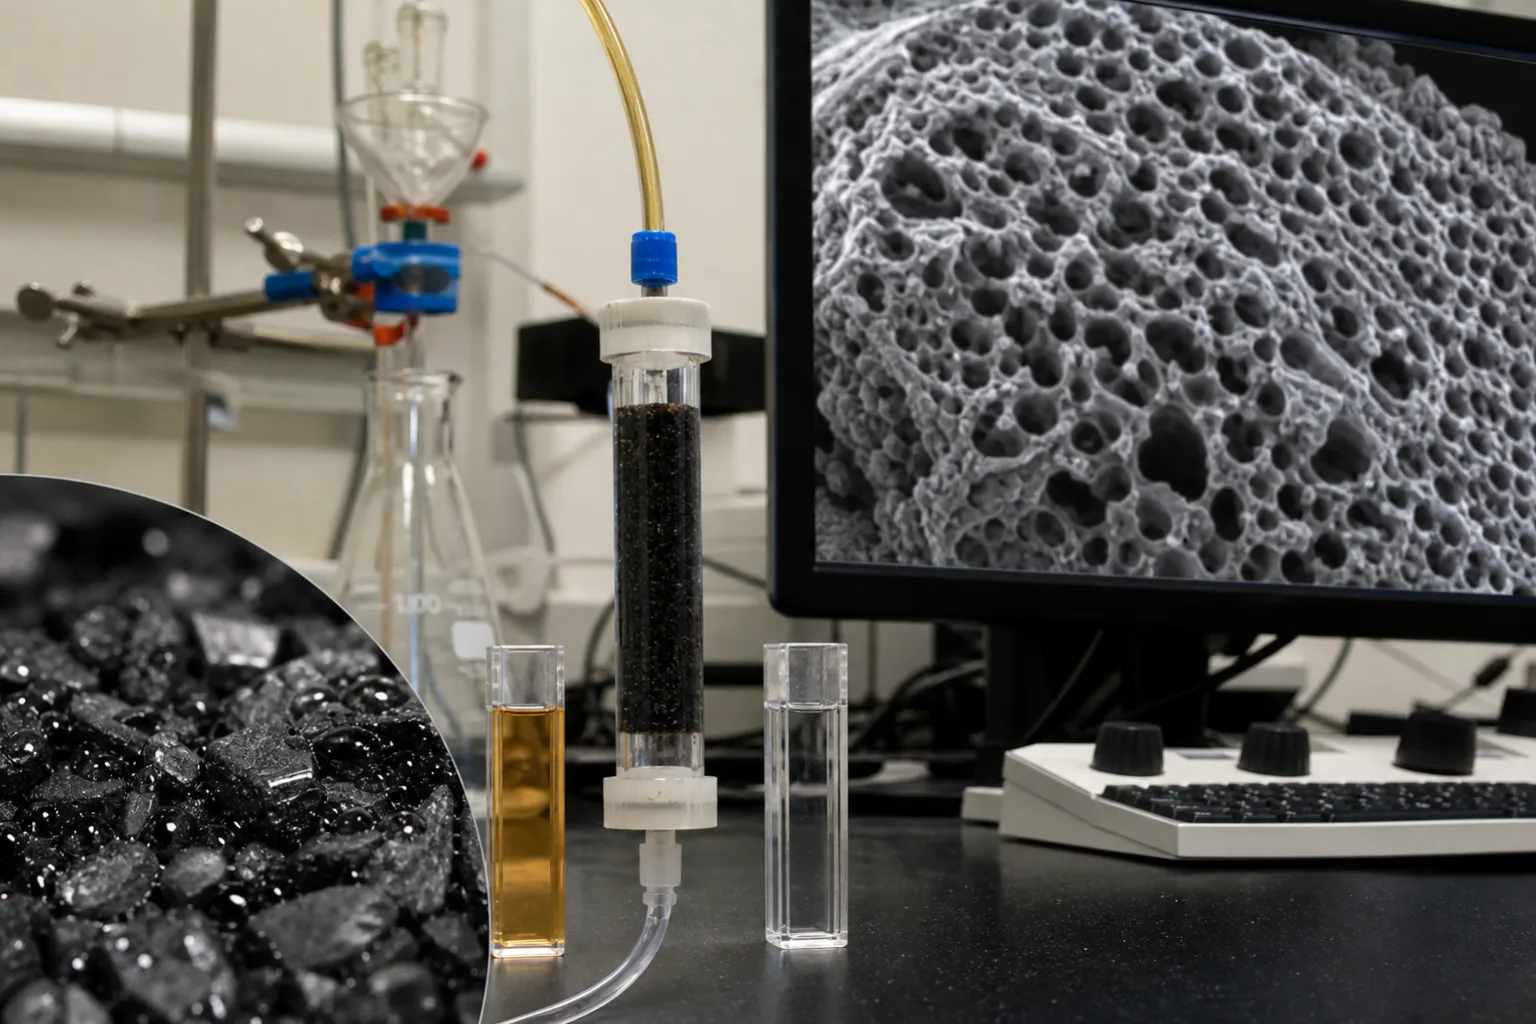 11Laboratory GAC fixed-bed column22Raw and treated sample pair33Wetted granular-carbon surface44Multiscale internal pore network
What to identify
- 1Laboratory GAC fixed-bed column
- 2Raw and treated sample pair
- 3Wetted granular-carbon surface
- 4Multiscale internal pore network
Figure takeaway
The eye sees the outer grain, while adsorption area is mostly inside. Decolorization is not a capacity measurement; target analysis and a mass balance are required.
How to verify it in the field
Use the same water for blanks and carbon/contact comparisons. Measure target, DOC/UV254, pH, temperature, carbon mass, loading, replicates, detection limits, and background competition.
Depth sampling shows the mass-transfer zone moving toward the outlet
A transparent pilot column has calibrated flow and ports down the bed; samples along depth reveal concentration profiles and approaching breakthrough.
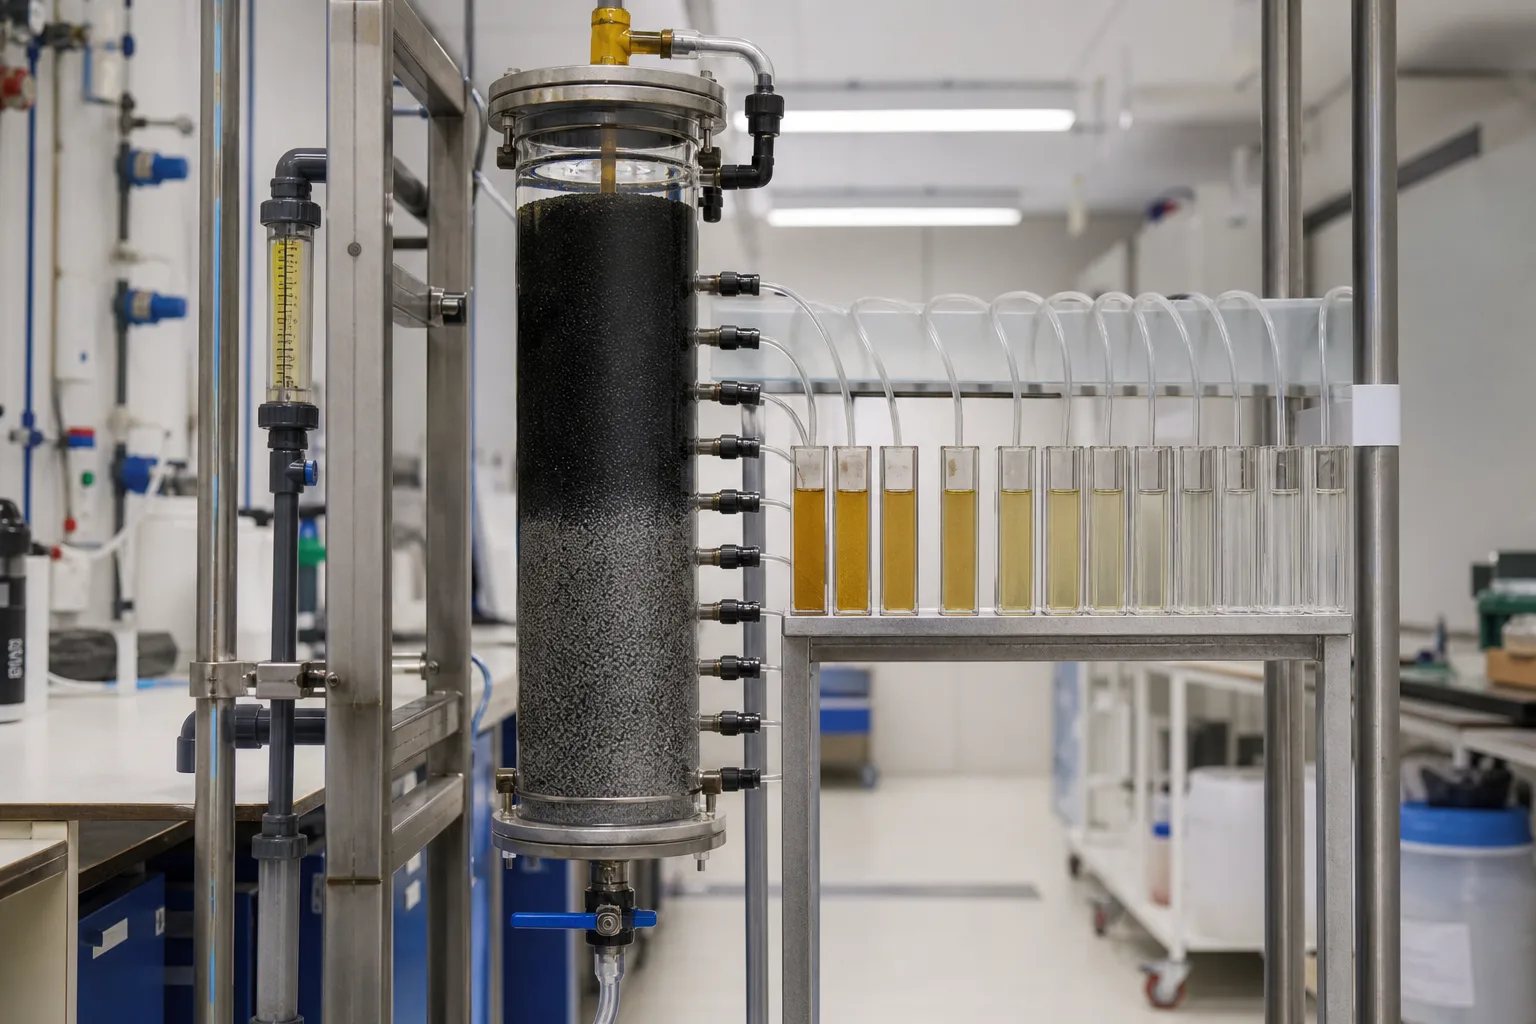 11Influent and calibrated flowmeter22Mass-transfer zone/effective bed33Sampling ports at multiple depths44Depth samples and breakthrough profile
What to identify
- 1Influent and calibrated flowmeter
- 2Mass-transfer zone/effective bed
- 3Sampling ports at multiple depths
- 4Depth samples and breakthrough profile
Figure takeaway
A fixed bed does not saturate everywhere at once. Loaded carbon trails the moving zone and fresher carbon lies ahead; depth profiles warn before final effluent breakthrough.
How to verify it in the field
Time-align inlet and depth targets and plot versus time, bed volumes, or carbon loading. Track EBCT, headloss, temperature, and NOM; confirm trends with repeat samples.
Parallel columns separate fresh media, capacity loss, NOM competition, and hydraulic short-circuiting
Four controlled columns with individual meters represent sufficient contact, loaded carbon, competitive preloading, and channeling/short EBCT or fines loss.
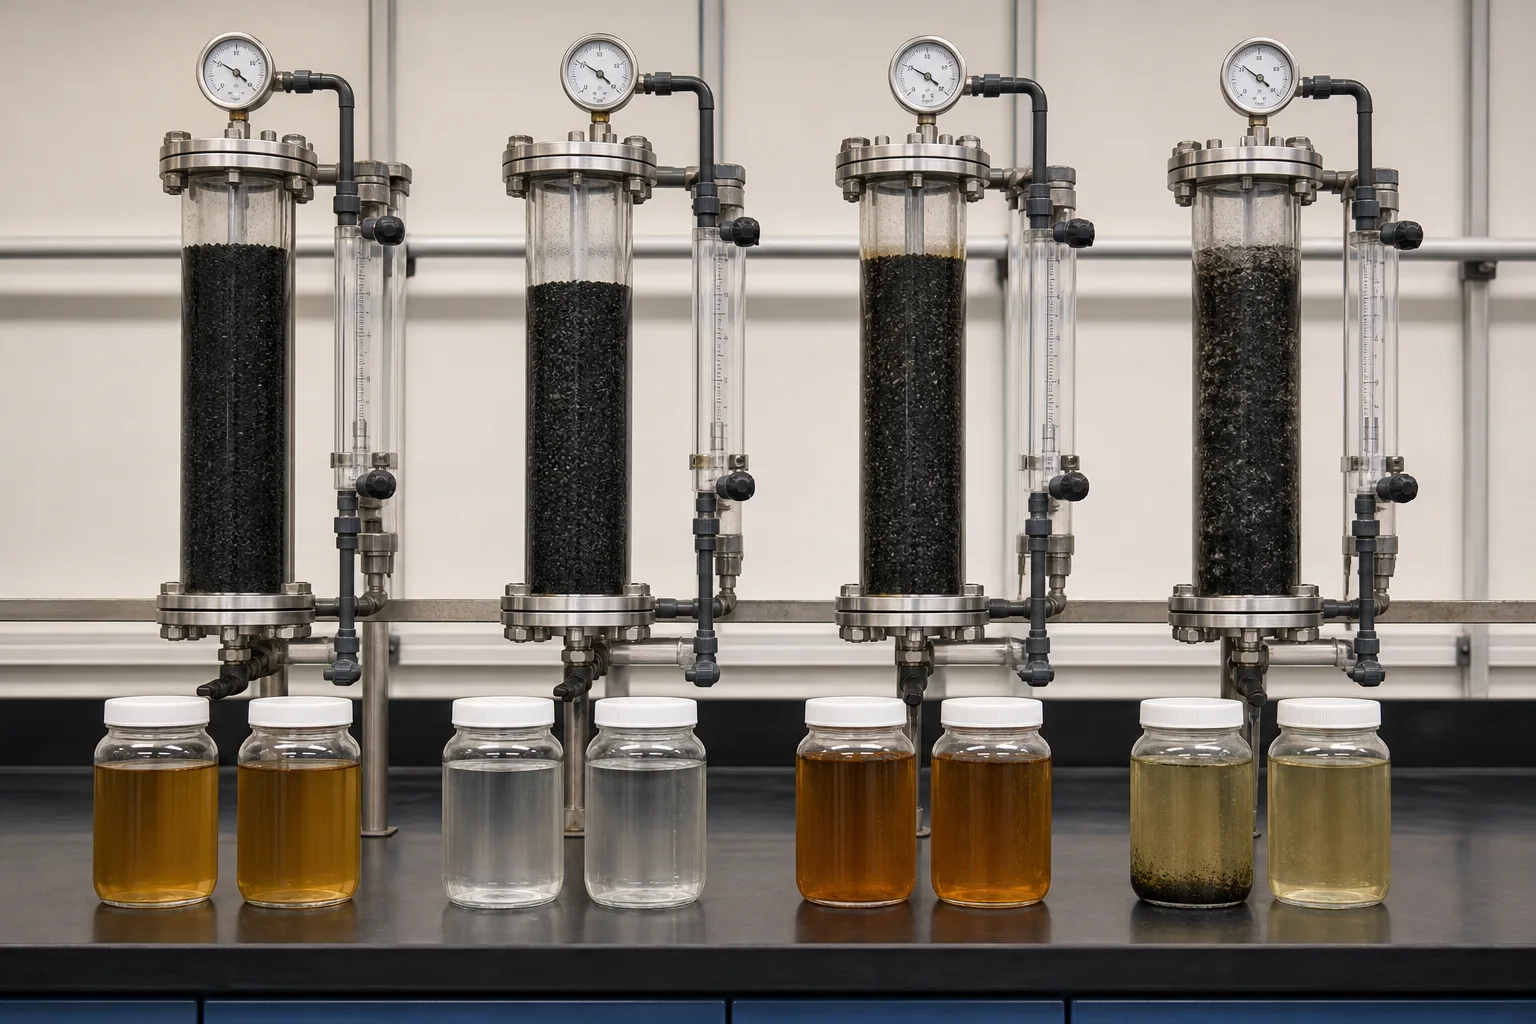 11Fresh carbon/sufficient EBCT22Loaded bed/target breakthrough33NOM competition/early exhaustion44Channeling, short EBCT, or fines loss
What to identify
- 1Fresh carbon/sufficient EBCT
- 2Loaded bed/target breakthrough
- 3NOM competition/early exhaustion
- 4Channeling, short EBCT, or fines loss
Figure takeaway
These are controlled test conditions, not diagnoses by color. Capacity exhaustion can occur at stable headloss; channeling can cause early leakage while local capacity remains unused.
How to verify it in the field
Hold feed water constant and calibrate flow. Compare target, DOC, headloss, bed height/mass, and fines; use tracer or depth samples to separate capacity from hydraulic failure.
Bed coring distinguishes uniform loading from deposits, biological activity, and local defects
Technicians take depth cores from an isolated cell; a uniform black surface contrasts with a deposit/biological patch, and trays preserve carbon and water samples.
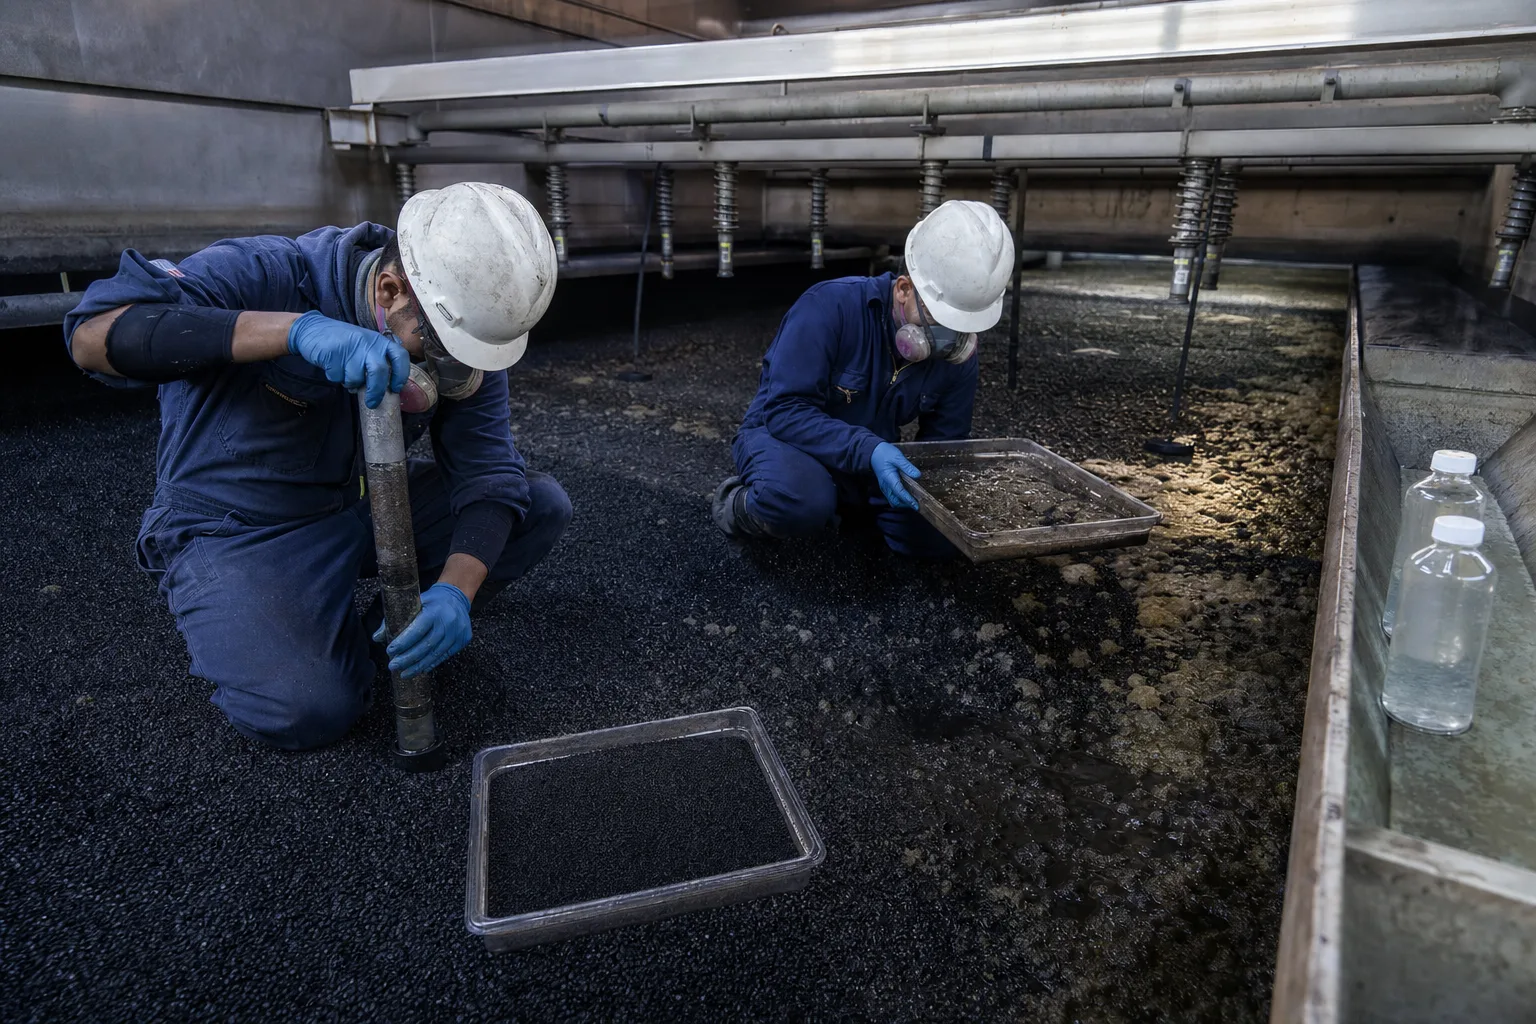 11Depth-resolved bed core22Uniform black GAC bed33Deposit/biological anomaly zone44Wash nozzles, water, and carbon samples
What to identify
- 1Depth-resolved bed core
- 2Uniform black GAC bed
- 3Deposit/biological anomaly zone
- 4Wash nozzles, water, and carbon samples
Figure takeaway
Black color does not prove remaining capacity, and a deposit does not automatically mean adsorption failure. Cores connect depth, wear, residual capacity, and biology to hydraulic and water-quality trends.
How to verify it in the field
Follow isolation, ventilation, and confined-space rules. Record location/depth and test bed height, size/wear, deposits, residual adsorption, and biological indicators against operating history.
Six steps from dissolved molecule to fixed-bed breakthrough
Adsorption capacity and transport rate are different; both shape bed performance.
1 Enter bed
Target + NOM → interstitial water
Carry molecules to carbon grains.
2 Cross film
Bulk water → particle boundary layer
Overcome external mass transfer.
3 Diffuse inward
Macro/mesopore → micropore
Reach high-area internal surfaces.
4 Adsorb
Molecule ↔ carbon surface
Concentrate target at the interface.
5 Move front
Loaded → transfer → fresh zone
Use bed depth and track depletion.
6 Break/change
Effluent rise → replace/reactivate
Restore capacity before control fails.
Four functional parts of a GAC system
Media, hydraulics, adsorption/biology, and renewal need separate evidence.
Carbon media
- Role
- Provide target-matched pores and surface chemistry
- Typical failure
- Wrong carbon, attrition/fines, preloading, pore blocking
- Evidence
- Feedstock/size/pores, isotherm or column, carbon mass and residual capacity
Bed hydraulics
- Role
- Provide effective depth, EBCT, and even distribution
- Typical failure
- Channeling, bed loss, short contact, headloss, poor wash
- Evidence
- Flow/depth/EBCT, headloss, tracer, depth samples, expansion/fines
Adsorption/BAC
- Role
- Adsorb targets and, where valid, biodegrade organics
- Typical failure
- NOM competition, breakthrough, weak or uncontrolled biology
- Evidence
- Target/DOC profile, breakthrough, oxygen/biology, disinfection constraints
Monitoring/renewal
- Role
- Trigger backwash, repair, replacement, or reactivation
- Typical failure
- Surrogate-only control misses compound breakthrough
- Evidence
- Risk targets, bed volumes/age, trends, carbon tests, renewal records
Select carbon and changeout using the source water, target list and limits, NOM, and pilot/RSSCT or reliable history. Powdered activated carbon (PAC) is dosed and removed with solids; its dose cannot be directly converted into GAC fixed-bed life.
Align three datasets on one timeline
Bed and hydraulics
Cell flow, carbon volume/depth, EBCT, headloss, valves, backwash time/intensity/expansion, carbon loss, and tracer response.
Competition and breakthrough
Targets, NOM/DOC/UV254, pH, temperature, turbidity, and upstream oxidation; collect influent, depth, and effluent samples together.
Age, capacity, and disposition
Bed volumes, loading per carbon mass, residual capacity/size/biology, reactivation/changeout batch, spent-carbon route, and lifecycle cost.
Separate capacity loss from hydraulic failure
- Combined signal
- Gradual target breakthrough, stable flow/headloss, and a depth front moving down
- Likely cause
- Normal capacity consumption by target/NOM
- Next step
- Check loading and bed volumes; switch or renew before the limit and confirm residual capacity
- Combined signal
- Headloss rises while target remains controlled; backwash restores headloss
- Likely cause
- Solids or biological deposits restrict hydraulics
- Next step
- Check upstream solids, expansion, and waste removal; do not call pressure recovery regeneration
- Combined signal
- Sudden early leakage, low/unstable headloss, and uneven depth samples
- Likely cause
- Channeling, bed loss, distribution fault, or lower EBCT
- Next step
- Verify flow, valves, bed height, fines, tracer, and multi-point samples before repairing
- Combined signal
- TOC/odor remains acceptable but a mobile target rises first
- Likely cause
- Compound-specific selectivity masked by a surrogate
- Next step
- Control on the earliest risk target and reassess carbon, lead-lag beds, and sampling
Four common misconceptions
Blacker or more carbon always adsorbs better
Appearance says nothing about accessible pores, surface chemistry, or remaining capacity.
Backwash regenerates saturated carbon
It removes solids and restores hydraulics, not most occupied adsorption sites.
No odor or low TOC proves every micropollutant is safe
Compounds break through in different orders; risk targets need direct monitoring.
GACs with similar iodine numbers are interchangeable
Pore distribution, feedstock, chemistry, particle size, and strength change rate and capacity.