Illustrated guide · Industrial water systems
Why do scaling, corrosion and biofouling often appear together?
Follow mineral supersaturation, electrochemical metal loss and microbial EPS into rough surfaces, hot spots, under-deposit microenvironments and a self-reinforcing mixed deposit.
Direct answer
Direct answer
Scale, corrosion and biofouling start by different mechanisms but amplify one another on the same cooling-water surface. Scale is a hard mineral layer produced when calcium salts, silica or other species become supersaturated under the local pH and wall temperature. Corrosion is electrochemical metal loss governed by anodic dissolution and cathodic reactions, influenced by oxygen, chloride, pH, material, stress and galvanic couples. Biofouling is attachment and growth of organisms plus extracellular polymeric substances (EPS) that trap organic matter and particles. Once combined, scale and corrosion roughness provide attachment and nucleation sites; EPS binds crystals, dust and corrosion products into a dense composite; the layer adds heat-transfer resistance and restricts flow, creating higher local wall temperature and low-shear zones; under-deposit oxygen, pH, ion and disinfectant gradients can create differential-aeration, crevice or pitting conditions and sometimes microbiologically influenced corrosion (MIC); corrosion products then provide another porous scaffold. A real deposit may therefore have slime at the water side, mineral/particle layers in the middle, and rust or pits at the metal. Detecting microbes does not by itself prove MIC, and a white scale does not explain every metal loss. Preserve location and layering, then combine chemistry, method-specific microbiology, coupons/probes, metallography and equipment performance. Control must also be combined: safe cycles and scale inhibition, material-compatible corrosion and disinfection programs, adequate velocity/distribution, dead-leg management, suspended-solids removal and risk-based cleaning/disinfection. One aggressive chemical, conductivity reduction or surface cleaning can leave the other feedback paths intact or shift risk to corrosion.
Four conditions turn three problems into one feedback loop
Separate initiation from interaction; a mixed deposit cannot be explained by one bulk-water number.
A rough, deposited or sheltered substrate appears
Scale, welds, pits, dust and porous rust reduce local shear and provide crystal nucleation and microbial attachment sites.
The surface microenvironment differs from the bulk sample
Wall temperature, flow, oxygen, pH, ion activity and disinfectant under a deposit can differ greatly from basin water.
EPS, particles and rust bind the layers
EPS captures minerals and solids; porous corrosion products trap more matter, increasing resistance, pressure drop and cleaning difficulty.
Control covers only one path or is unstable
Scale-only treatment, biocide without deposit removal, excessive acid or prolonged oxidation can transfer risk rather than close the loop.
An opened tubesheet often contains white mineral, green slime, rust and blocked tubes together
Different elevations and flow zones show different appearances; location and layer samples must remain separate.
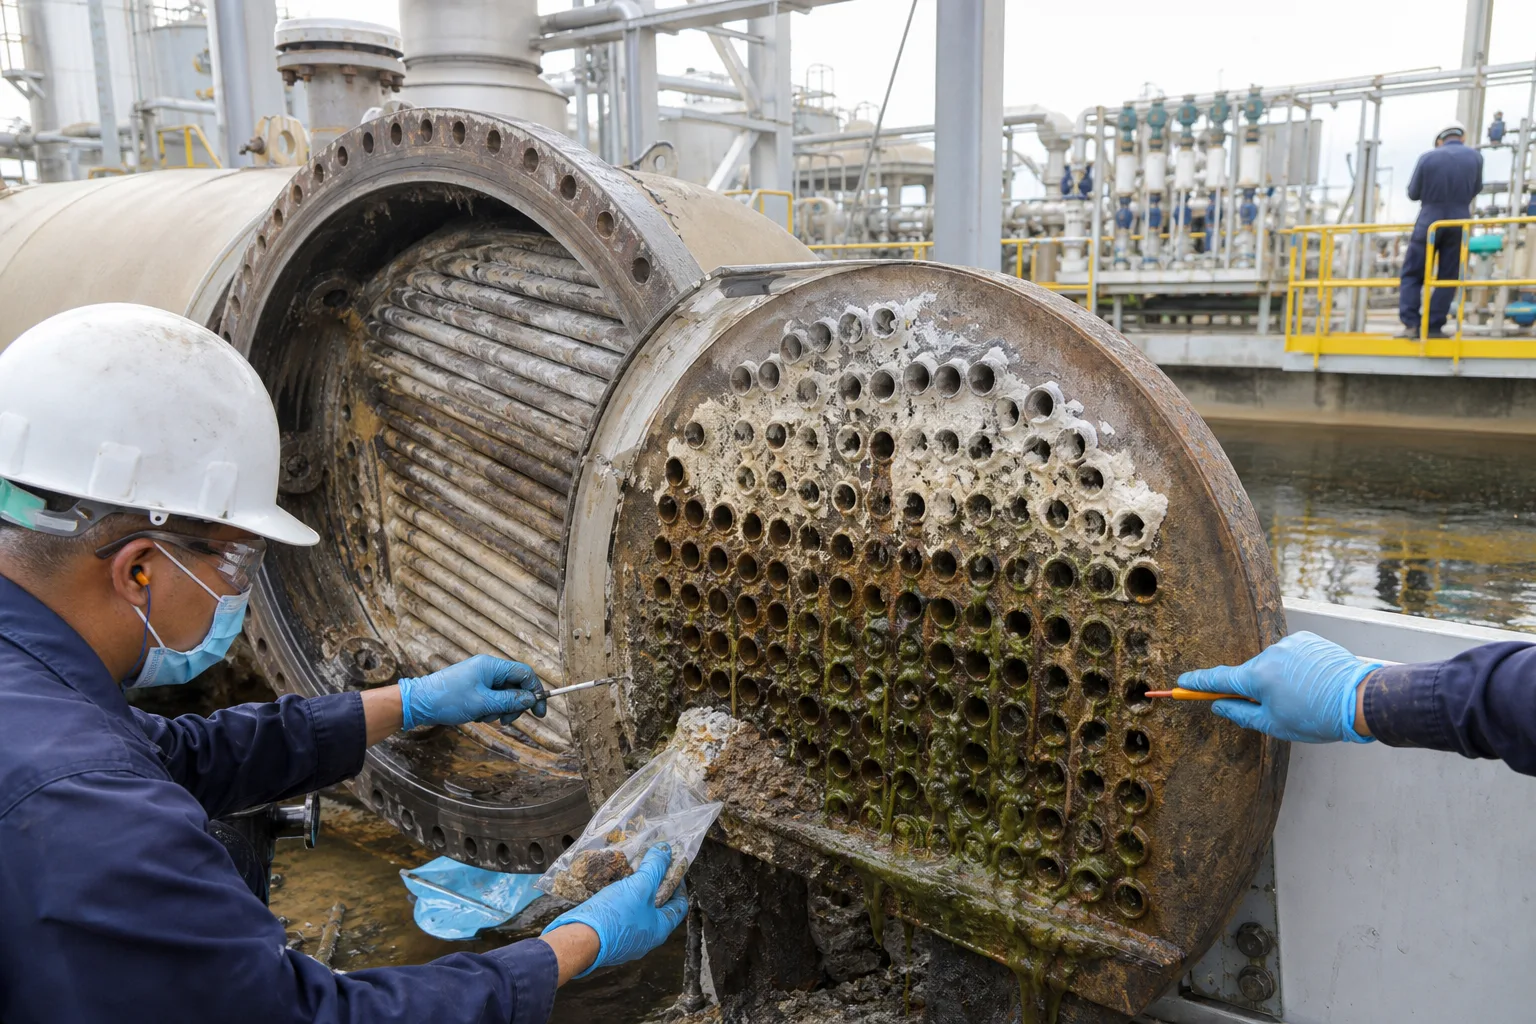 11Hard white mineral scale22Green biofilm/EPS slime33Brown-black corrosion products and pits44Composite deposit restricting tube mouths
What to identify
- 1Hard white mineral scale
- 2Green biofilm/EPS slime
- 3Brown-black corrosion products and pits
- 4Composite deposit restricting tube mouths
What this proves
Three colors on one exchanger are not three unrelated failures. Distribution, temperature and velocity create zones, then the deposits merge at tubes and tubesheet.
Field check
After isolation, depressurization and LOTO, map top/middle/bottom and inlet/outlet, photograph thickness, and preserve slime, hard scale, rust and substrate separately, including an undisturbed sample.
A cross-section shows biofilm, mineral layer, corrosion products and a pit above base metal
Wet slime captures particles; pale mineral creates a barrier; rust fills the cavity below. Direction and interfaces are as important as total composition.
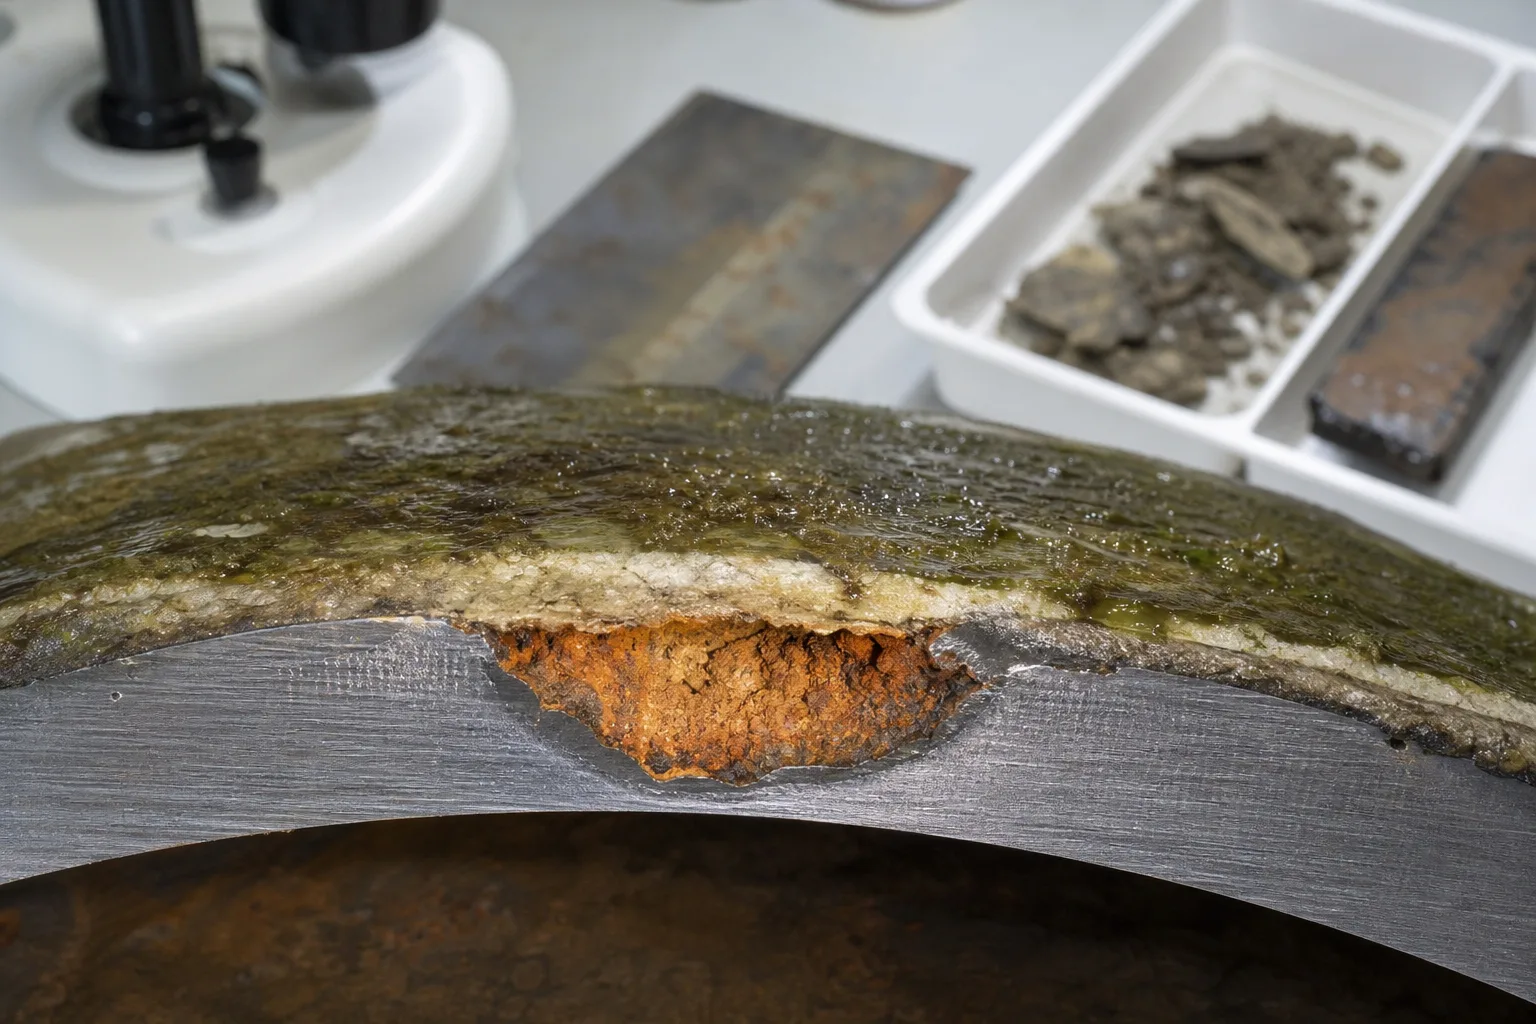 11Water-side biofilm and EPS22Mineral crystal/particle layer33Under-deposit rust and pit44Remaining base metal and pit mouth
What to identify
- 1Water-side biofilm and EPS
- 2Mineral crystal/particle layer
- 3Under-deposit rust and pit
- 4Remaining base metal and pit mouth
What this proves
The deposit creates its own oxygen, pH, ion and residual gradients. That supports under-deposit corrosion; calling it MIC additionally requires evidence that microbial activity influenced the corrosion mechanism.
Field check
Mark water-side orientation; analyze layers and substrate separately with microscopy, chemistry/mineralogy and metallography, preserving microbiology samples by the chosen method.
Four matched loops separate scale, corrosion, biofilm and their composite
White scale, rust, green slime and mixed layers are teaching comparisons; material, heat flux, velocity, chemistry, time and treatment must match.
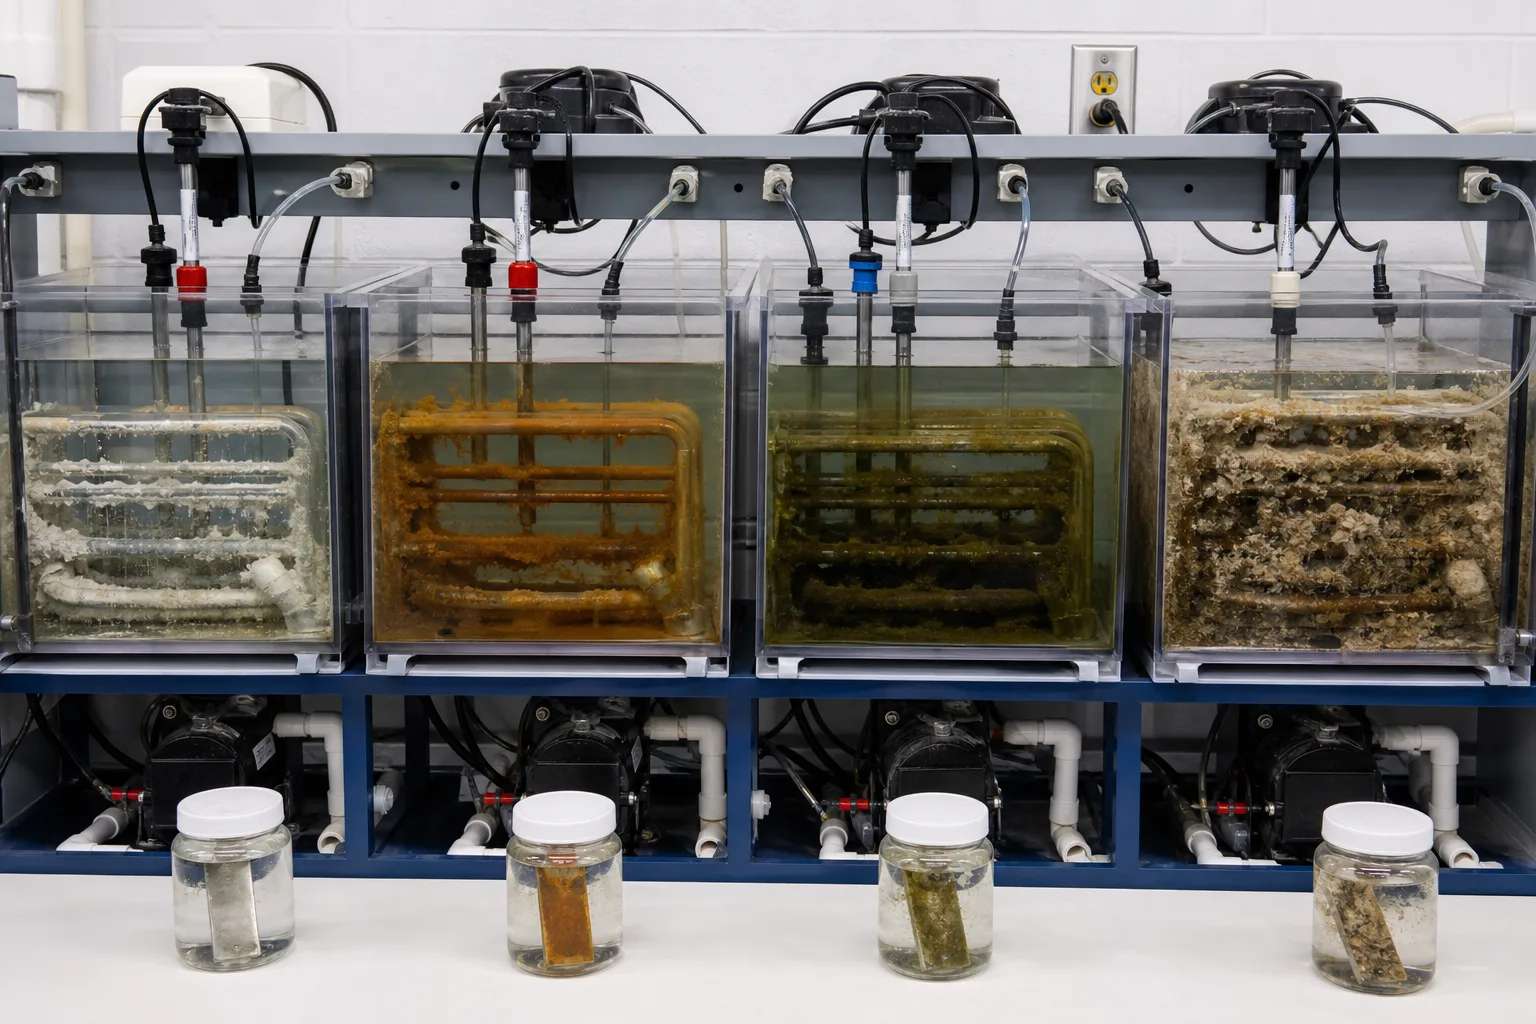 11Supersaturation-led mineral scale22Electrochemical metal loss and rust33Microbial growth and EPS44Scale–rust–biofilm composite
What to identify
- 1Supersaturation-led mineral scale
- 2Electrochemical metal loss and rust
- 3Microbial growth and EPS
- 4Scale–rust–biofilm composite
What this proves
Any path can initiate, but the composite often produces the steepest pressure, heat-transfer and localized-metal-loss effects. Experiments should distinguish what appeared first from what was later trapped.
Field check
Trend chemistry, oxidant/residual, temperature/velocity/heat flux, method-specific biology, mass loss/probes, pressure drop and heat-transfer coefficient with blanks and repeats.
Four removed exchangers and deposits show that appearance is only first-line evidence
Clean, mineral, rust and dark bio/mixed conditions are paired with waters, deposits and probes.
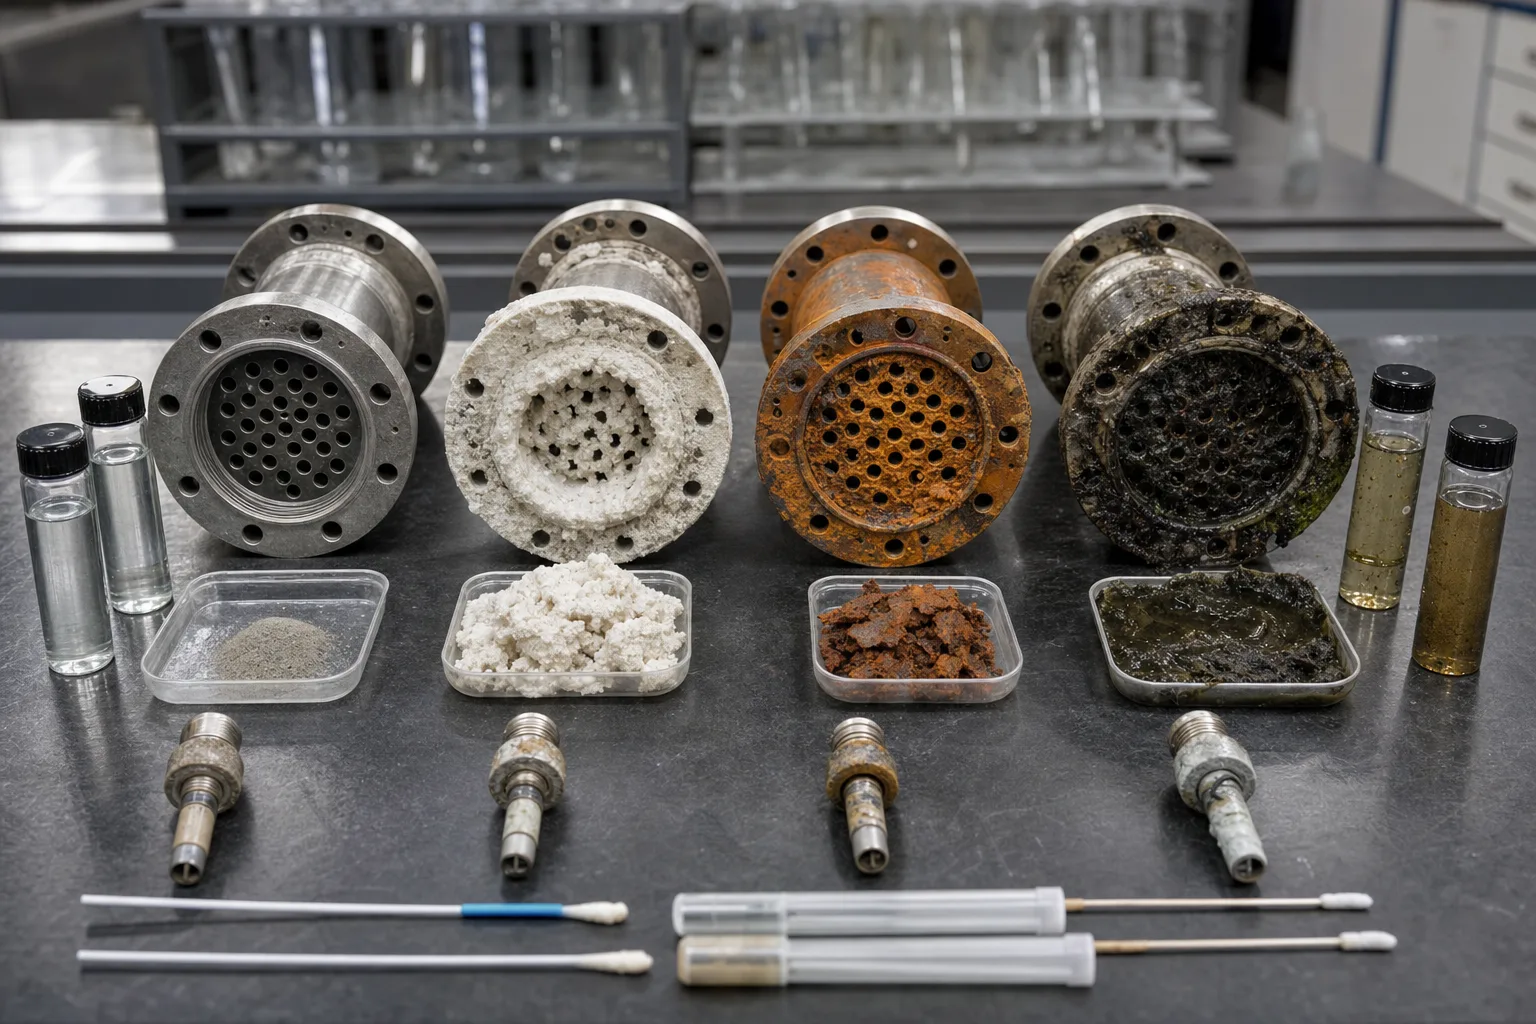 11Clean baseline and original metal22White hard scale and crystals33Corroded tubesheet and rust44Dark slime/composite fouling
What to identify
- 1Clean baseline and original metal
- 2White hard scale and crystals
- 3Corroded tubesheet and rust
- 4Dark slime/composite fouling
What this proves
Color is not unique: iron enters biofilm, organics cover scale and process leaks alter deposits. Structure, composition and performance must agree.
Field check
Measure wet/organic fraction, elements/mineralogy and required microbiology; measure pit depth, wall thickness and mass loss; compare pressure drop, approach and cleaning recovery.
An inspection combines borescope distribution, tube mapping, layered deposits and corrosion specimens
The borescope maps tubes; identified samples, bottles, deposits and coupons align water, deposit and metal evidence.
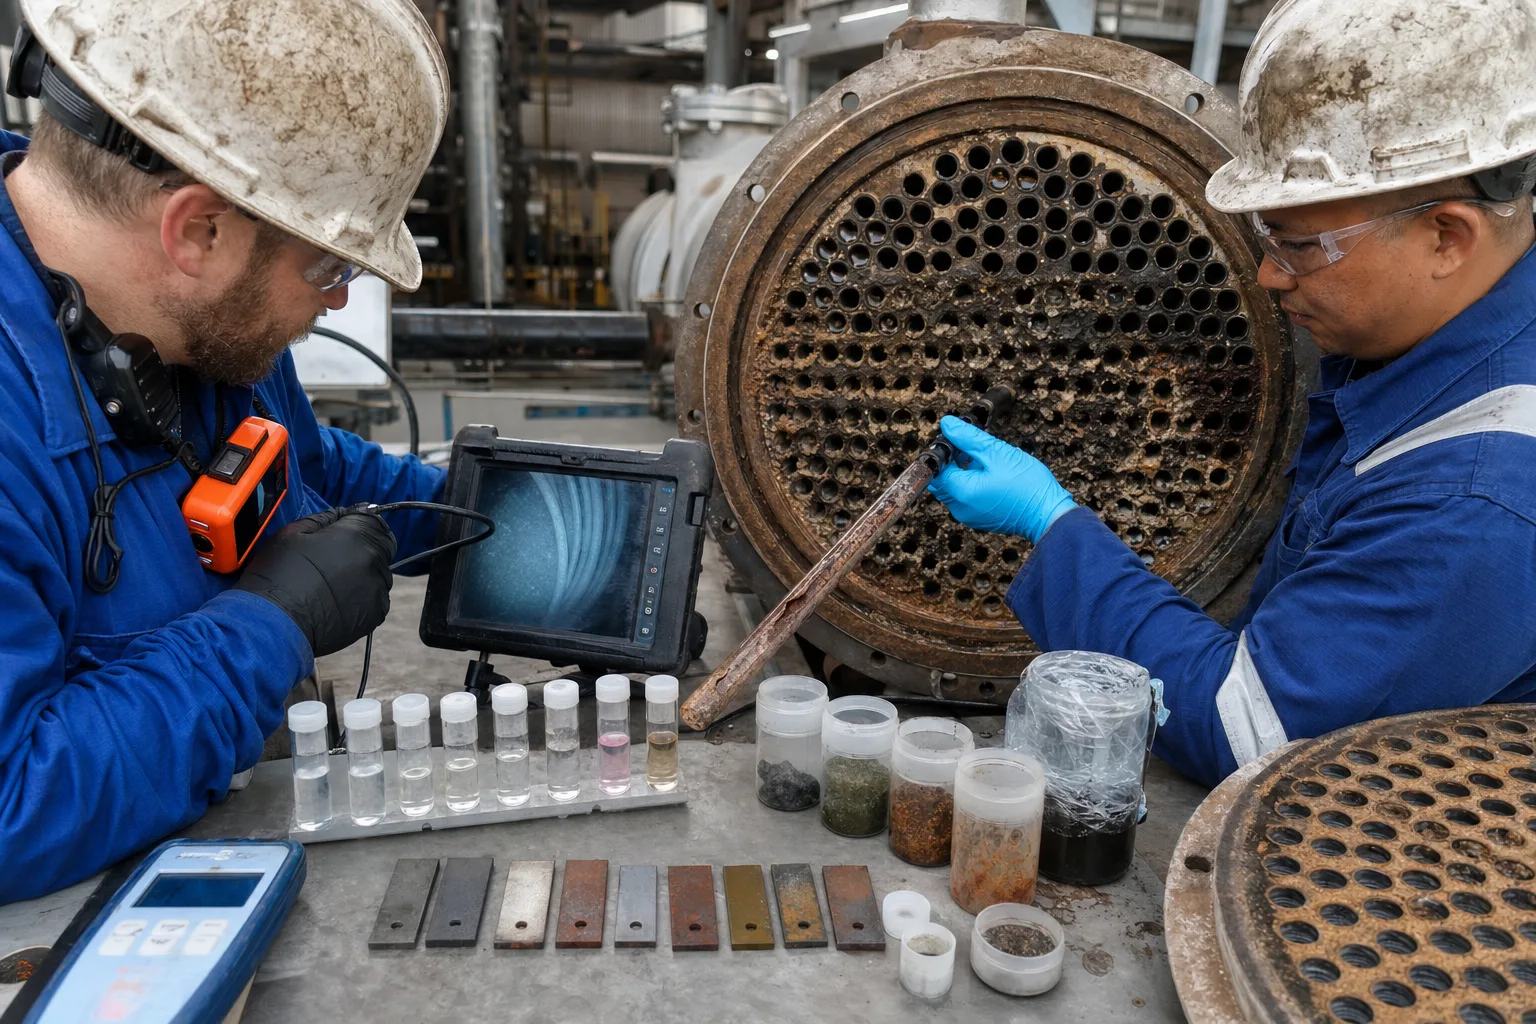 11Borescope tube distribution22Tube-numbered layered deposit samples33Coupons, probes and substrate specimens44Plugging, pit and wall-thickness map
What to identify
- 1Borescope tube distribution
- 2Tube-numbered layered deposit samples
- 3Coupons, probes and substrate specimens
- 4Plugging, pit and wall-thickness map
What this proves
A detected organism or element matters only when location, layer, time and equipment response form one causal chain. Post-cleaning recovery must also be verified.
Field check
Complete tube maps, images, thickness/pit data and samples before cleaning; use material/OEM-compatible cleaning with exposure and waste controls, then retest cleanliness, leaks, performance and limits.
Seven steps from one attachment site to composite failure
The chain can begin with scale, rust, solids or biofilm; find the earliest supported cause.
1 Initiation
Supersaturation/corrosion cell/organisms/solids
Establish distinct mineral, electrochemical, biological or particulate sources.
2 Attachment/nucleation
Crystals/cells/dust → rough and low-flow areas
Create uneven initial coverage.
3 Performance barrier
Thin layer → resistance, pressure loss, hot and low-shear zones
Drive surface conditions away from bulk water.
4 EPS capture
Biofilm → crystals, solids and rust
Consolidate a composite and increase disinfectant demand.
5 Under-deposit gradients
Limited transfer → O₂/pH/ion/residual gradients
Enable differential aeration, crevice/pitting and possible MIC.
6 Rust scaffold
Metal loss → porous oxides and pits
Add nucleation and trapping sites.
7 Evidence/correction
Heat/DP/wall/hygiene → layered samples and controls
Target the dominant path and verify recovery.
Prove four mechanisms separately before linking them
Overlap and color do not establish cause.
Scale/mineral
- Primary effect
- Hard layer from supersaturation and nucleation
- Amplification
- Hot surface, pH/alkalinity/hardness/silica, low flow and rough deposits; gradients below scale
- Priority evidence
- Full chemistry, mineralogy, hardness/thickness/location, heat transfer and cleaning response
Corrosion/metal loss
- Primary effect
- Uniform loss, pitting, crevice or galvanic damage
- Amplification
- Deposits create oxygen cells; biology may alter chemistry; rust traps solids
- Priority evidence
- Wall/pit, coupons/ER/LPR, metallography, material/couple, rust and chemistry
Biofouling/EPS
- Primary effect
- Slime, demand and solid capture
- Amplification
- Scale/rust shelter growth; thick film creates dead zones and may influence corrosion
- Priority evidence
- Located slime, ATP/culture/qPCR as method-defined, microscopy, residual penetration, velocity/age
Solids/hydraulics/operation
- Primary effect
- Dust, leaks and rust supply load; low flow determines deposition
- Amplification
- Particles seed scale and host biology; bypass/standby concentrates all paths
- Priority evidence
- TSS/PSD/turbidity, side-filter removal, process tracers, flow distribution and shutdown history
Microbial detection, elevated ATP or black deposits alone do not prove MIC. MIC is a mechanism claim requiring consistency among microbial activity, pit morphology, under-deposit chemistry, corrosion rate, location and time.
Retain three evidence groups on one timeline
Bulk water and treatment
Makeup/loop chemistry, cycles, pH/alkalinity/hardness/silica/chloride, TSS/PSD/organics, temperature, disinfectant and inhibitor residuals, feed/blowdown/filter actions.
Surface and layers
Tube maps, directional photos, thickness/slime, layered mineral/element/organic/microscopy/microbiology, rust, pit depth/wall thickness and material.
Equipment and hygiene outcomes
Approach/U/pressure drop, pump power, corrosion coupons/probes, leaks, cleaning recovery, dead zones/water age, drift and water-management indicators.
Use location, layers, performance and time
- Signal
- Approach worsens with hard white crystals on hot surfaces and slowly rising pressure drop
- Suspect first
- Supersaturation/local-wall-temperature scale, later capturing solids or biofilm
- Next step
- Check full chemistry, local heat/flow, mineralogy and thickness; verify cycles, pH/inhibitor and cleaning recovery
- Signal
- Average corrosion is modest but deep pits sit below mixed brown-black deposits
- Suspect first
- Differential-aeration/crevice under-deposit corrosion; MIC is possible but unproven
- Next step
- Preserve cross-section; compare pits, layers, microbiology, material/couple and corrosion trends rather than naming MIC from one culture
- Signal
- Slime and biological indicators rise, return residual falls and pressure drop changes quickly
- Suspect first
- EPS-led fouling with dead zones, intermittent operation or poor penetration
- Next step
- Map velocity/water age/bypass and residual distribution; evaluate cleaning/disinfection and solids removal under the water-management program
- Signal
- Loose grey-brown solids, TSS and pressure drop rise with poor side-filter removal or a process tracer
- Suspect first
- Dust/process leak/rust-led fouling that provides scale and biofilm scaffold
- Next step
- Analyze particles, locate the leak and maldistribution, verify side-filter flow/removal, then remove deposits and correct source/hydraulics
Four common misconceptions
White is scale, green is algae and black is MIC
Color is not unique; use layers, chemistry, structure, location and outcomes.
Acceptable basin water rules out under-deposit problems
Surface temperature, flow, pH, oxygen and residual can be very different.
Detecting bacteria proves MIC
Microbes are common; their activity must be linked to the corrosion mechanism.
One strong chemical solves all three
Acid, oxidant and dispersant have material and side-effect limits; combined controls need verification.