Illustrated guide · Industrial water systems
What do cycles of concentration mean in cooling water?
Turn a conductivity setpoint into a dimensionless mass balance, reconcile chemistry and flow methods, and set cycles from water chemistry and equipment evidence.
Direct answer
Direct answer
Cycles of concentration (CoC) express how many times a suitable nonvolatile, relatively nonreactive constituent in recirculating cooling water has concentrated relative to makeup: CoC=Ccirculating/Cmakeup. Temperature-compensated conductivity is a practical online proxy; chloride or another unaffected conservative tracer can cross-check it. CoC is not the number of physical trips around the loop and is not a constant created by the controller. At steady state, M·Cm=(B+D+L)·Cc, so CoC=M/(B+D+L). Only when drift D, leakage, overflow and other liquid loss L are small does CoC≈M/B. With M=E+B+D+L and negligible D/L, B=E/(CoC−1) and M=E·CoC/(CoC−1). These equations explain both the water saving and diminishing return of higher cycles. Chemistry- and flow-based cycles should agree over the same stable period. A large gap points to meters, sample location, temperature compensation, probe fouling, makeup changes, unmetered losses, process leakage, chemical addition or precipitation. A target cannot be copied from a generic “3” or “6”; it must fit makeup chemistry, local wall temperature, pH/alkalinity, hardness/silica, chloride/sulfate, treatment, materials, microbiological control and discharge limits, then be verified by heat-transfer, corrosion and deposit results.
Four conditions make a cycle value credible
Define boundary and tracer before applying a formula, or a precise ratio can still be wrong.
Pair numerator and denominator in one stable period
Makeup switching, rain/reuse blending, load changes and basin inventory transients invalidate an instantaneous ratio. Pair representative samples and correct inventory change.
Use a genuinely conservative indicator
Conductivity is convenient but treatment adds ions; hardness, alkalinity and silica can react or precipitate. Chloride can help unless chloride treatment, brine or process leakage affects it.
Include every liquid salt outlet in the flow method
M/B overstates cycles when drift, leaks, overflow, backwash or sampling are material. Verify actual valve flow, meter zero/range and accumulation period.
Let chemistry and equipment establish the target
The same CoC means different risk with soft, reclaimed or high-silica makeup. Wall temperature, materials, treatment and residence time matter.
A control room needs flow, valve, sample and corrosion evidence—not one conductivity setpoint
Makeup/blowdown meters, the control valve, trends, paired bottles and corrosion coupons form one cycle-control record.
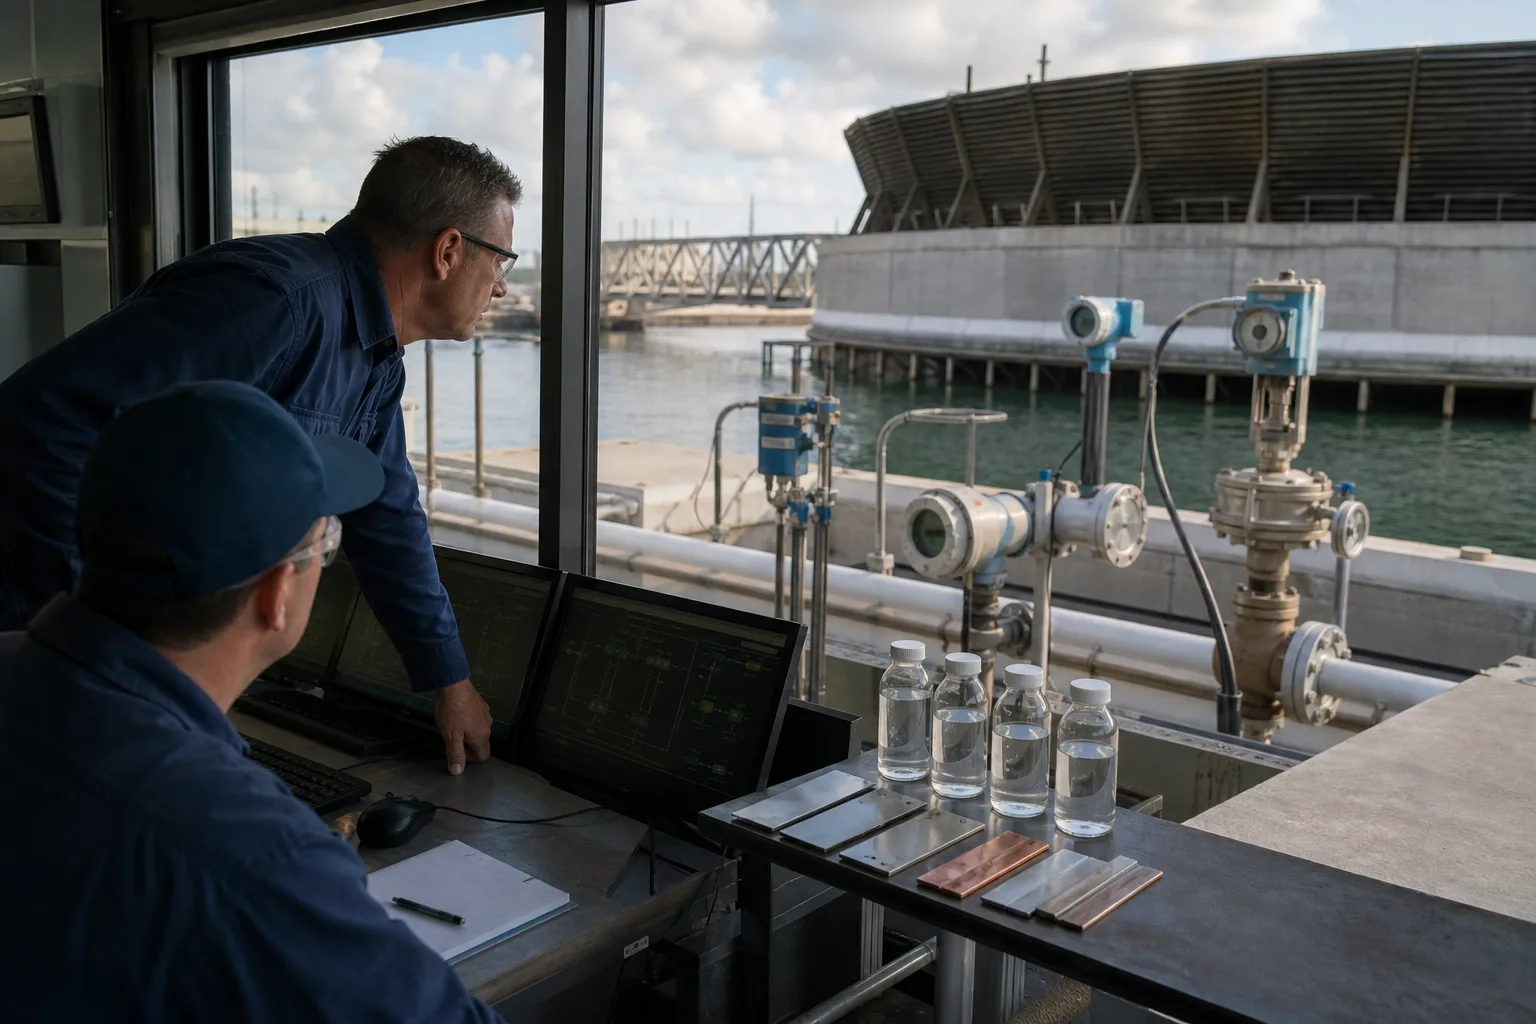 11Makeup/blowdown totals22Blowdown valve and actual flow33Makeup–circulating–blowdown samples44Control trends and corrosion coupons
What to identify
- 1Makeup/blowdown totals
- 2Blowdown valve and actual flow
- 3Makeup–circulating–blowdown samples
- 4Control trends and corrosion coupons
What this proves
The controller triggers blowdown, chemistry says how concentrated the loop is, flow balance shows where water went and equipment results prove whether the target is safe.
Field check
Align M, B, valve position, basin level, temperature-compensated conductivity and sample times; verify that cumulative B actually increases when the valve opens.
Parallel laboratory measurements show that different indicators need not yield the same cycle
Conductivity, chloride, hardness, alkalinity and silica can be measured on matched water; residues show that some mass has left the liquid as precipitate.
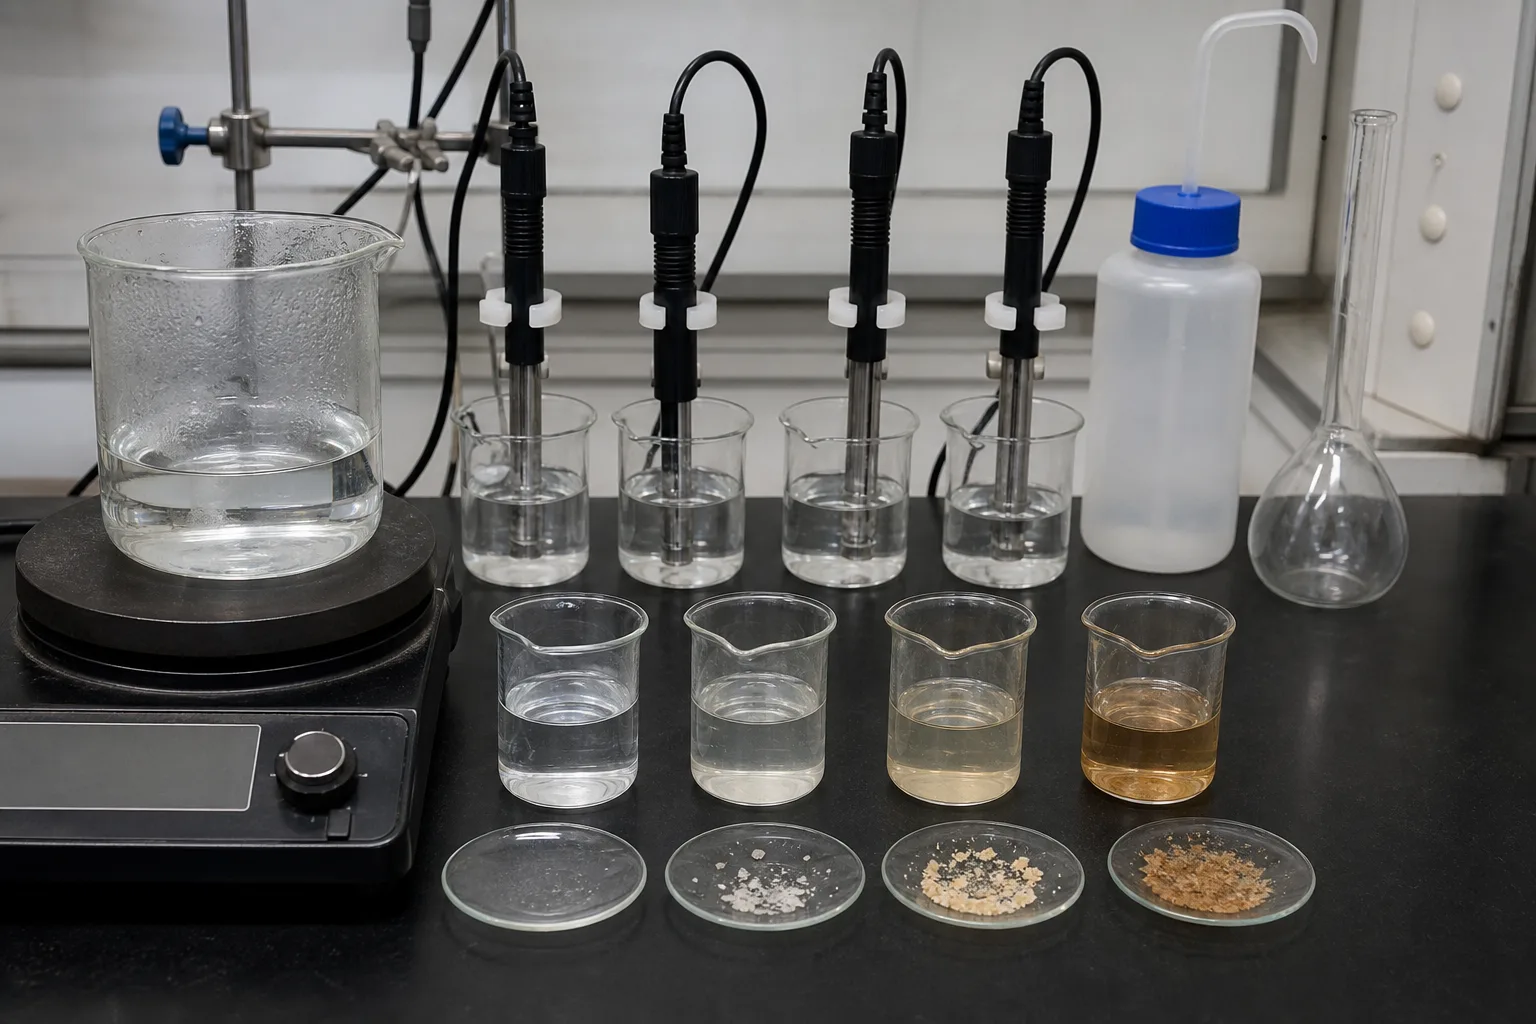 11Paired conductivity and temperature22Conservative tracer such as chloride33Nonconservative hardness/alkalinity/silica44Precipitate and mass destination
What to identify
- 1Paired conductivity and temperature
- 2Conservative tracer such as chloride
- 3Nonconservative hardness/alkalinity/silica
- 4Precipitate and mass destination
What this proves
Do not average disagreeing conductivity, chloride and hardness cycles. The difference diagnoses chemical addition, leakage, precipitation, analysis error or mismatched timing.
Field check
Use paired samples, one method/lab and QC; check ion balance, deposit chemistry, treatment ion contribution and proximity to feed points or dead legs.
A balance rig places M, E, B, D/L and basin inventory inside one boundary
Makeup tank, tower, basin, meters, blowdown and sample points make a traceable water-and-salt system; steady and transient periods are different.
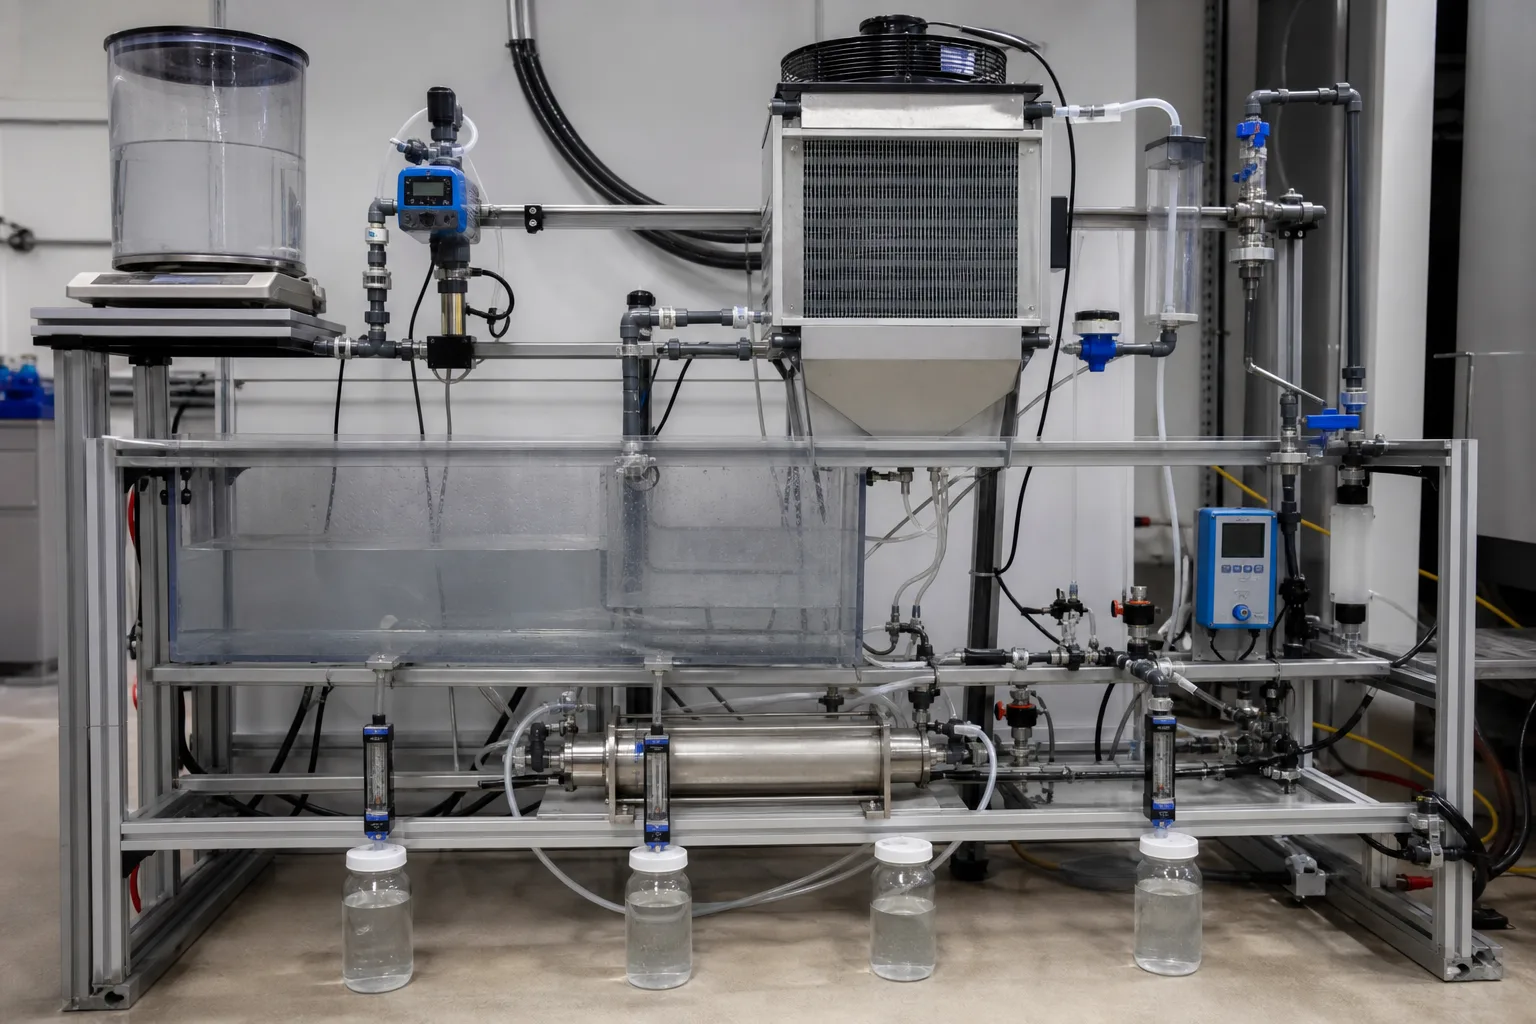 11Makeup tank, weight or M meter22Tower evaporation and drift boundary33Basin level and inventory change44Blowdown B, side losses and sampling
What to identify
- 1Makeup tank, weight or M meter
- 2Tower evaporation and drift boundary
- 3Basin level and inventory change
- 4Blowdown B, side losses and sampling
What this proves
The flow method is not two meter readings. Rising inventory stores makeup and falling inventory releases old water. Correct inventory and all liquid outlets before comparing M/(B+D+L) with chemistry.
Field check
Use a stable 24-hour or longer window; log start/end volume, M/B totals, drift, overflow/leak, filter backwash and sampling; field-check meter zero and volume/time.
Low, optimized and excessive cycles require two axes: water loss and heat-surface result
Matched-load sections represent low-CoC/high-blowdown, verified optimum and scale beyond the chemistry limit.
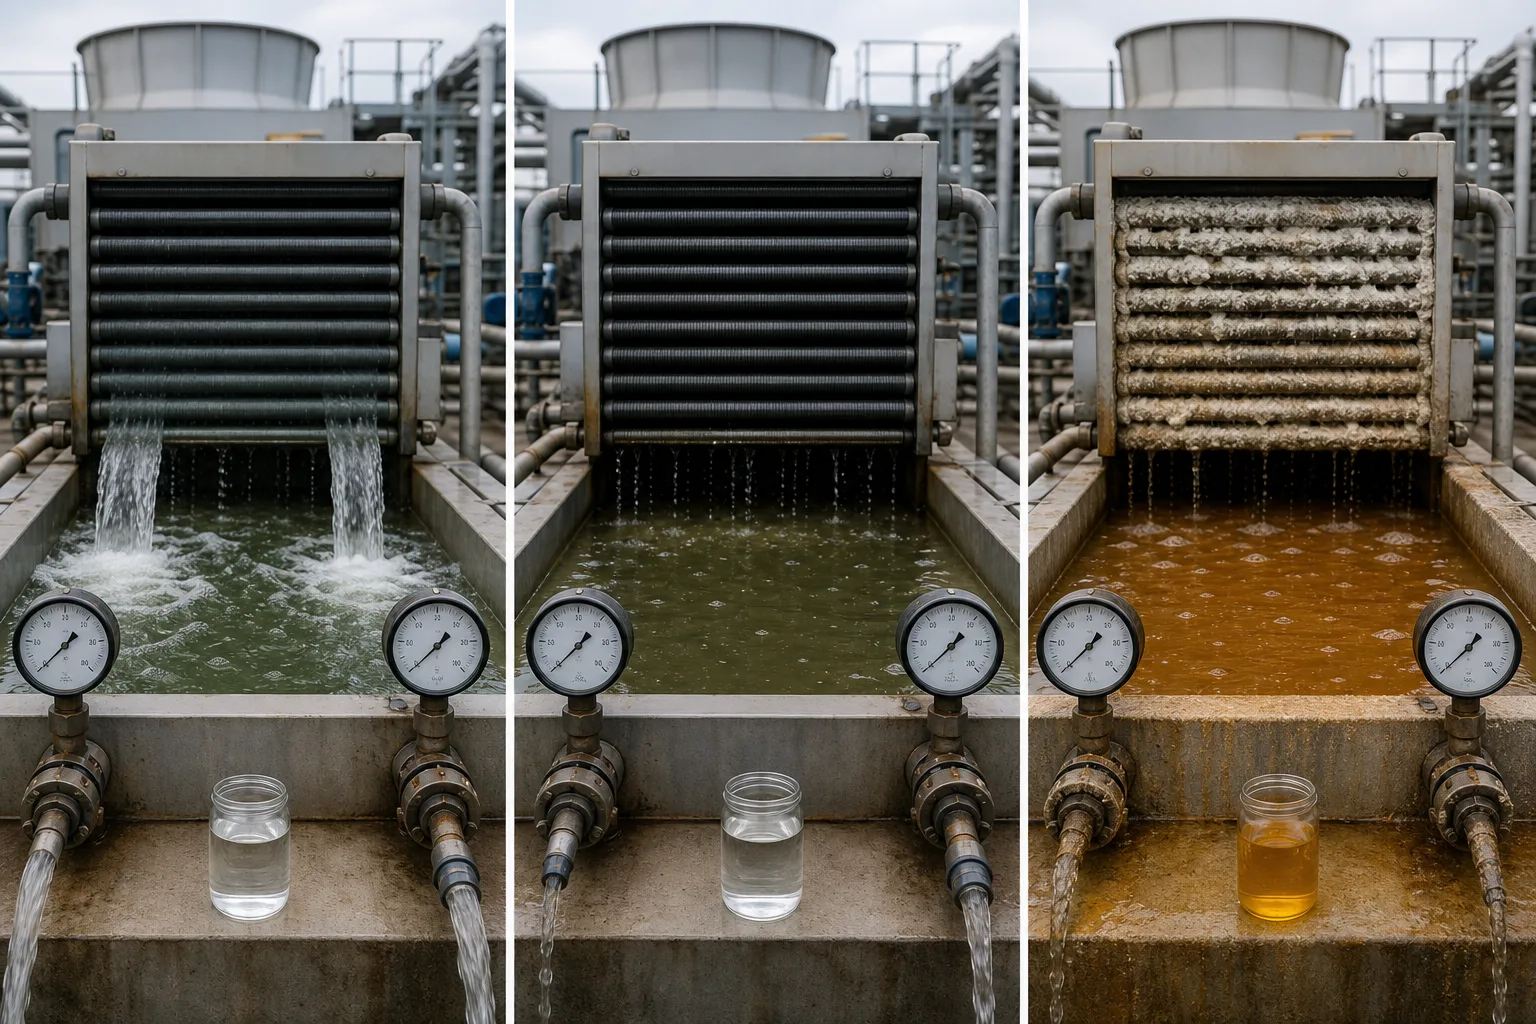 11Low CoC: clean-looking but high blowdown22Optimized CoC: water-risk balance33Excess CoC: heat-surface deposits44Matched flow, temperatures and samples
What to identify
- 1Low CoC: clean-looking but high blowdown
- 2Optimized CoC: water-risk balance
- 3Excess CoC: heat-surface deposits
- 4Matched flow, temperatures and samples
What this proves
CoC is an operating coordinate, not a water-quality grade. The highest stable band that meets heat-transfer, corrosion, hygiene and discharge requirements is useful; lower or higher alone is not better.
Field check
Compare M/E/B, range/approach, pressure drop, saturation, residual, corrosion, deposits and microbiological control at equal load and makeup.
Field verification connects online conductivity, a portable meter, the valve and real blowdown flow
A representative loop sample is checked while valve, piping and volumetric/flow measurement are observed.
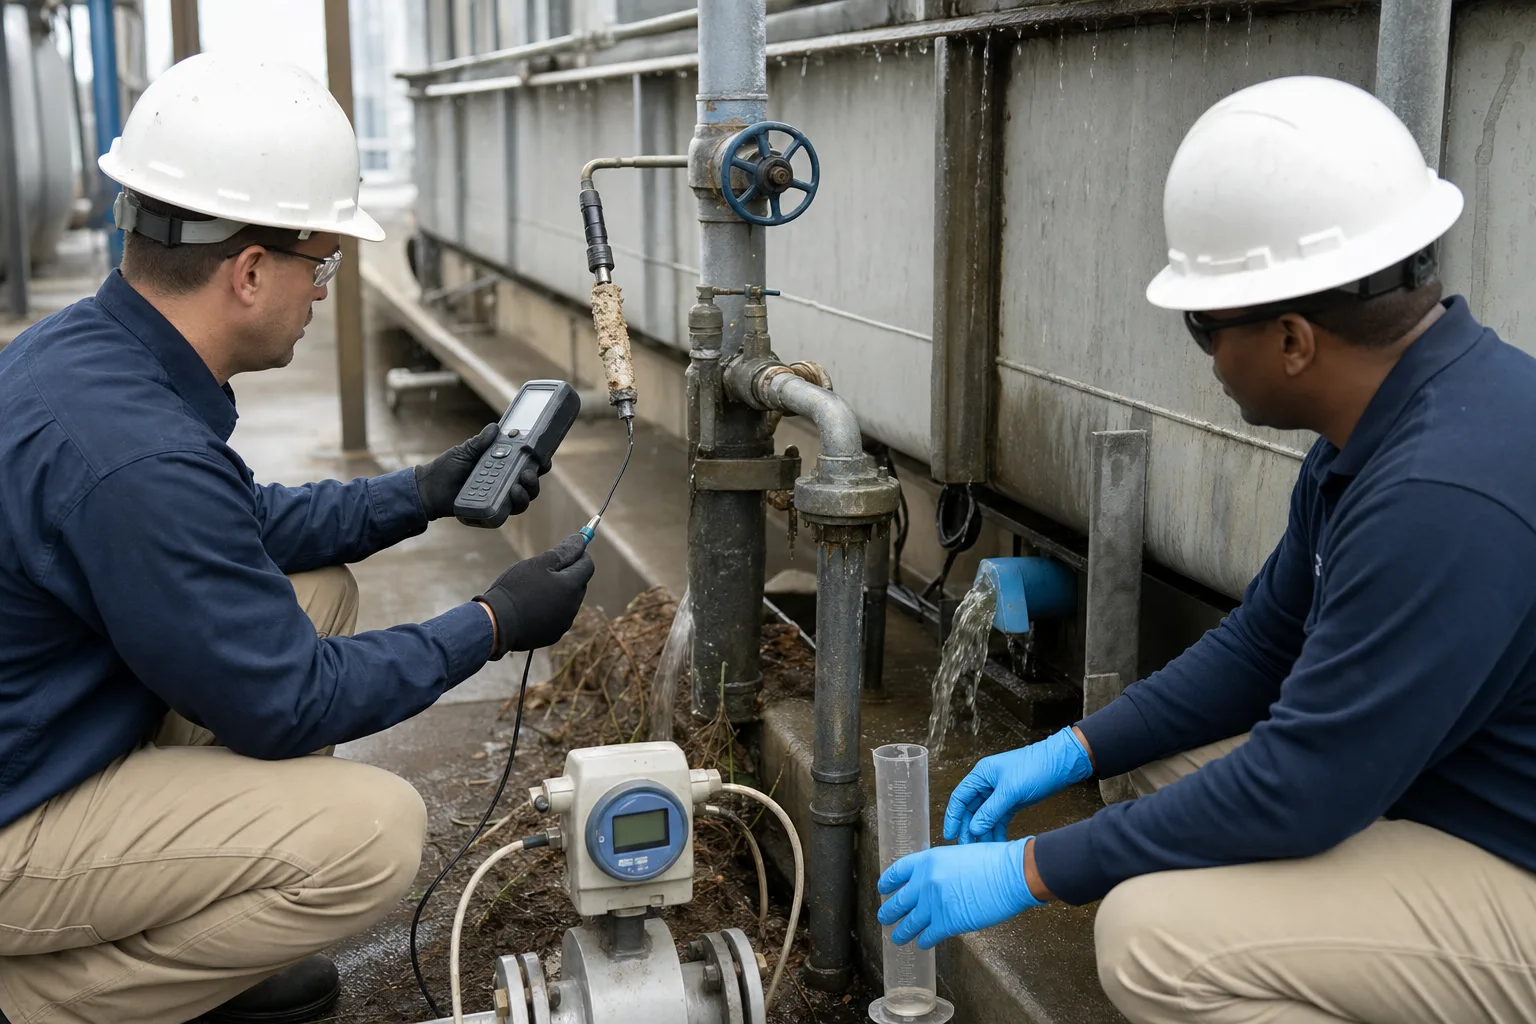 11Portable EC/temperature check22Online transmitter and sample flow33Blowdown valve, line and backpressure44Actual B by meter or volume/time
What to identify
- 1Portable EC/temperature check
- 2Online transmitter and sample flow
- 3Blowdown valve, line and backpressure
- 4Actual B by meter or volume/time
What this proves
A displayed cycle is credible only when makeup baseline, probe, sample flow, valve flow and mass balance agree. Controller output percent is not blowdown flow.
Field check
Clean/calibrate the probe, verify temperature compensation and location, map valve position to measured flow, inspect blockage/backpressure and return field results to the trend record.
Eight steps from definition to safe setpoint
Calculate, control and acceptance are separate tasks.
1 Define boundary
Tower, basin, loop, makeup, blowdown and all liquid exits
Keep all flows and salts in one system.
2 Baseline makeup
Source → paired sample/flow
Record Cm and source changes.
3 Select tracer
Conductivity + verified ion
Separate online proxy from conservative mass.
4 Sample loop
Representative point → Cc
Avoid feed points and dead zones.
5 Chemistry CoC
Cc ÷ Cm
Calculate the concentration definition.
6 Flow CoC
M ÷ (B+D+L), inventory-corrected
Detect hidden water loss independently.
7 Reconcile
Chemistry ↔ flow ↔ equipment
Find instrumentation, leakage, treatment or precipitation effects.
8 Set and verify
Chemistry limit → control band → results
Balance water, heat transfer, corrosion, hygiene and discharge.
Four evidence types answer four questions
Definition, metering, control and outcome must cross-check one another.
Paired chemistry/tracer
- Normal duty
- Define actual Cc/Cm
- Mismatch
- Source change, nonconservative ion, addition/leak, temperature or lab error
- Verification
- Paired EC/Cl⁻ and analysis, time/location, QC and ion balance
M/B/D/L and basin inventory
- Normal duty
- Close water and liquid salt outlets
- Mismatch
- Missing overflow/backwash, meter bias, inventory change or valve-no-flow
- Verification
- Totals, start/end volume, volume-time check and loss survey
Conductivity control/blowdown valve
- Normal duty
- Turn target into repeatable control band
- Mismatch
- Fouled/no-flow probe, wrong hysteresis, blocked/backpressured valve
- Verification
- Raw EC/T, output, valve, actual B, alarm and calibration
Treatment/equipment outcome
- Normal duty
- Prove safety at real load
- Mismatch
- Saturation, low treatment, hot spot, corrosion/biofilm or discharge issue
- Verification
- Chemistry/residual, heat performance, corrosion, deposits, microbes and permit data
Most controllers maintain a conductivity band with hysteresis, not an exact mathematical CoC. Judge performance over a window consistent with residence time and load.
Retain three evidence groups for one period
Inputs and uncertainty
Paired samples, EC/temperature/tracer, M/B/D/L, inventory, calibrations, sample QC and source changes.
Control execution
Raw EC, setpoint/hysteresis, valve position and actual flow, treatment feed, alarms, manual bypass, backwash and starts/stops.
Boundary outcomes
Water per heat load, exchanger approach/DP, saturation, corrosion, deposits, microbes, cleaning and discharge compliance.
Compare chemistry CoC, flow CoC and outcomes
- Signal
- Conductivity CoC is much higher than chloride CoC
- Suspect first
- Ionic treatment raises EC, temperature/probe bias, or chloride/sample error
- Next step
- Quantify treatment ions, verify temperature and repeat paired QC samples; do not average the two
- Signal
- Chemistry CoC is below M/B
- Suspect first
- Uncounted drift/leak/overflow/backwash, B under-reading or tracer precipitation
- Next step
- Add D/L/inventory, measure valve flow, use a conservative tracer and inspect deposits/leaks
- Signal
- Chemistry and flow agree but water use remains high
- Suspect first
- Target cycles are low, heat/evaporation baseline is wrong or other users are inside M
- Next step
- Normalize M/E to load, confirm boundary and evaluate marginal benefit only within safe chemistry
- Signal
- Cycles are stable but heat, corrosion or hygiene worsens
- Suspect first
- Target exceeds present chemistry/treatment/load or the defect is not cycle-driven
- Next step
- Do not dismiss equipment evidence; inspect full chemistry, treatment, velocity/wall temperature, deposits and water-management controls
Four common misconceptions
Six cycles means six trips around the loop
CoC is a concentration or mass-balance ratio; water molecules have different residence times.
M/B always equals CoC
Only near steady state when other liquid salt exits are small.
Conductivity represents every ion
It is a total ionic response affected by treatment, precipitation and makeup.
Meeting the setpoint proves excellent operation
Heat transfer, corrosion, microbes, discharge and water intensity must also pass.