Illustrated guides · Membranes & separation
How can membrane fouling, scaling and damage be distinguished?
All three can reduce production, raise pressure drop or degrade permeate quality, but the mechanisms differ: foulants accumulate from the feed, scale precipitates after dissolved salts exceed solubility, and damage breaks the membrane or element integrity barrier.
Direct answer
Direct answer
Do not diagnose from color or one raw KPI. Calibrate instruments and normalize permeate flow, salt passage and stage pressure drop; locate the change by stage, vessel and element; then combine water/deposit analysis, cleaning response and integrity checks. First-stage pressure-drop growth often points to particulate or early biofouling, while last-stage deposition at high concentration supports scaling. A sudden salt-passage increase isolated to one vessel or element, without a matching pressure-drop change, should put seals, interconnectors, glue lines, product tube and membrane damage ahead of system-wide cleaning. Chemical oxidation is also irreversible selective-layer damage.
Answer four questions before assigning a cause
Appearance is a clue only; the conclusion must explain performance, location, material and reversibility.
Which normalized KPI changed first?
Pressure drop, normalized permeate flow and normalized salt passage describe channel resistance, water productivity and selectivity. Raw flow also changes with temperature, pressure and feed salinity.
Where is the anomaly?
The lead stage sees incoming solids and microbes; the tail stage sees the highest concentration. A single-vessel or single-element step change is more consistent with bypass, assembly or local damage.
What is deposited, and does cleaning work?
Bio/organic layers, colloids, metals and crystals require different analyses and cleaners. Similar colors do not prove similar chemistry, and a wrong cleaner may worsen damage.
Has integrity been lost?
Oxidation, creases, tears, glue-line failure, product-tube cracks and O-ring bypass all increase salt passage. Probing, offline testing and component inspection are needed.
Three removed elements: appearance is only the first layer
The left element carries dark deposits, the center carries pale crystalline/powdery deposits, and the right sheet is torn. The rack and sample jars remind us to preserve installation position and process history.
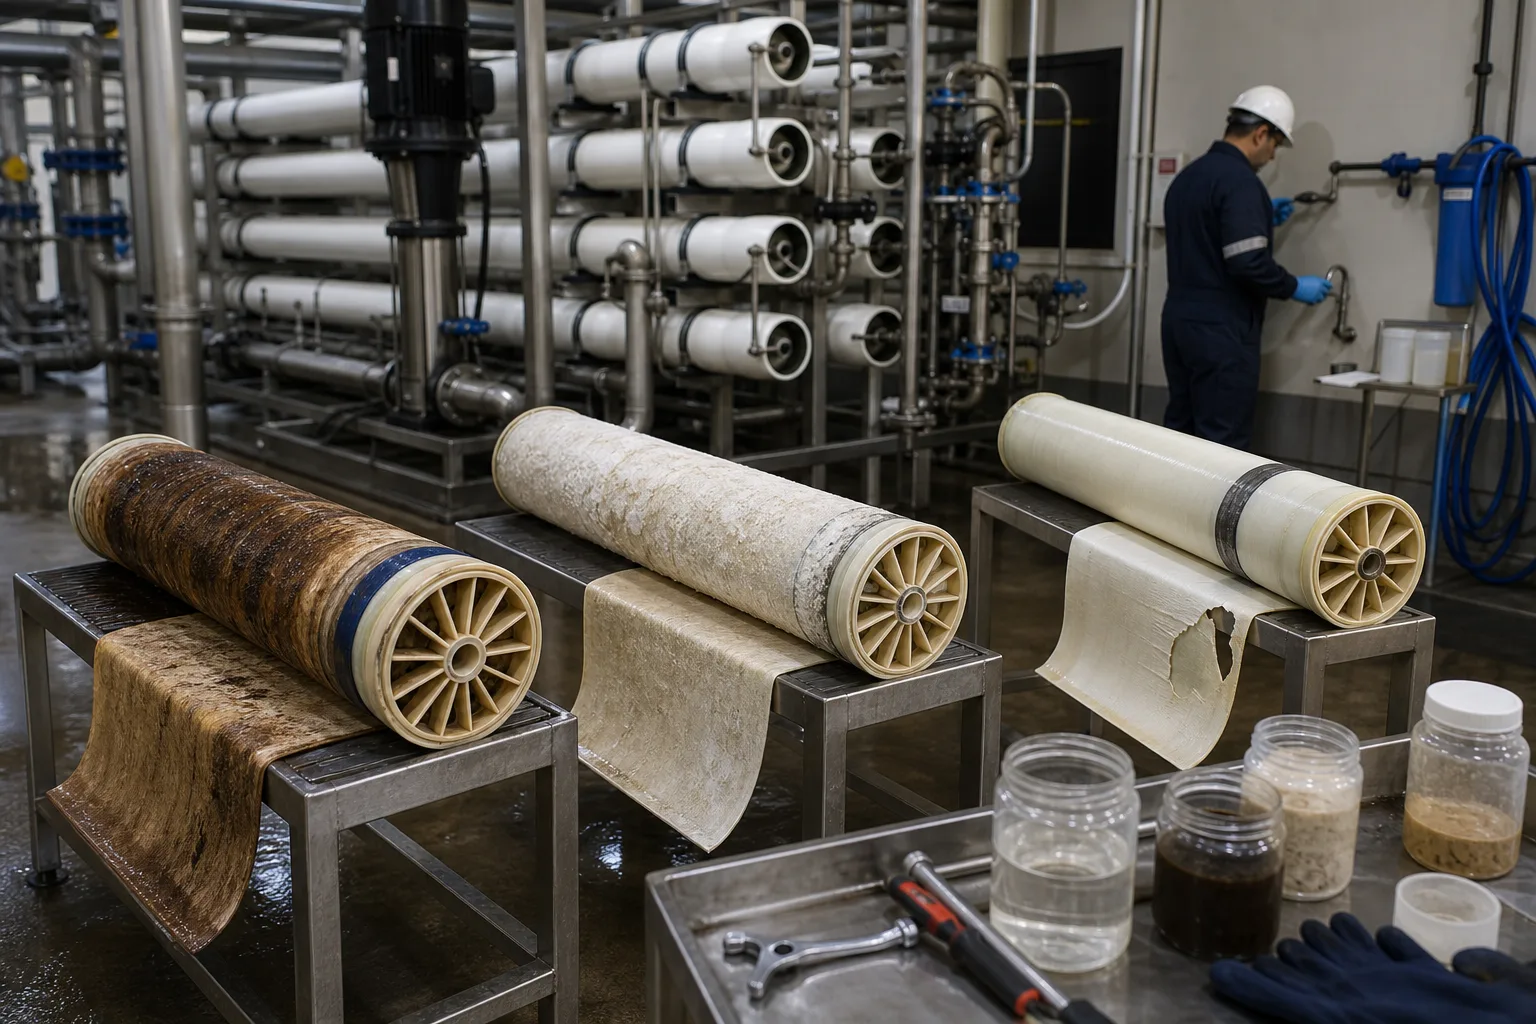 11Dark fouled element22Pale scaled element33Torn sheet or outer wrap44Deposit and water samples
What to identify
- 1Dark fouled element
- 2Pale scaled element
- 3Torn sheet or outer wrap
- 4Deposit and water samples
What the image proves
Fouling, scaling and mechanical damage can coexist. Dark does not prove biology and white does not prove calcium carbonate; location, chemistry and performance response must agree.
How to verify on site
Record stage, vessel and element position before removal. Preserve wet deposit, membrane and water samples before cleaning destroys the evidence.
Three surface clues: adhesive layer, crystals and integrity gaps
From left to right the close-up shows a sticky mixed deposit, faceted mineral crystals, and cracks/holes in a sheet or coating. Real samples may be mixed and chemical damage may be invisible.
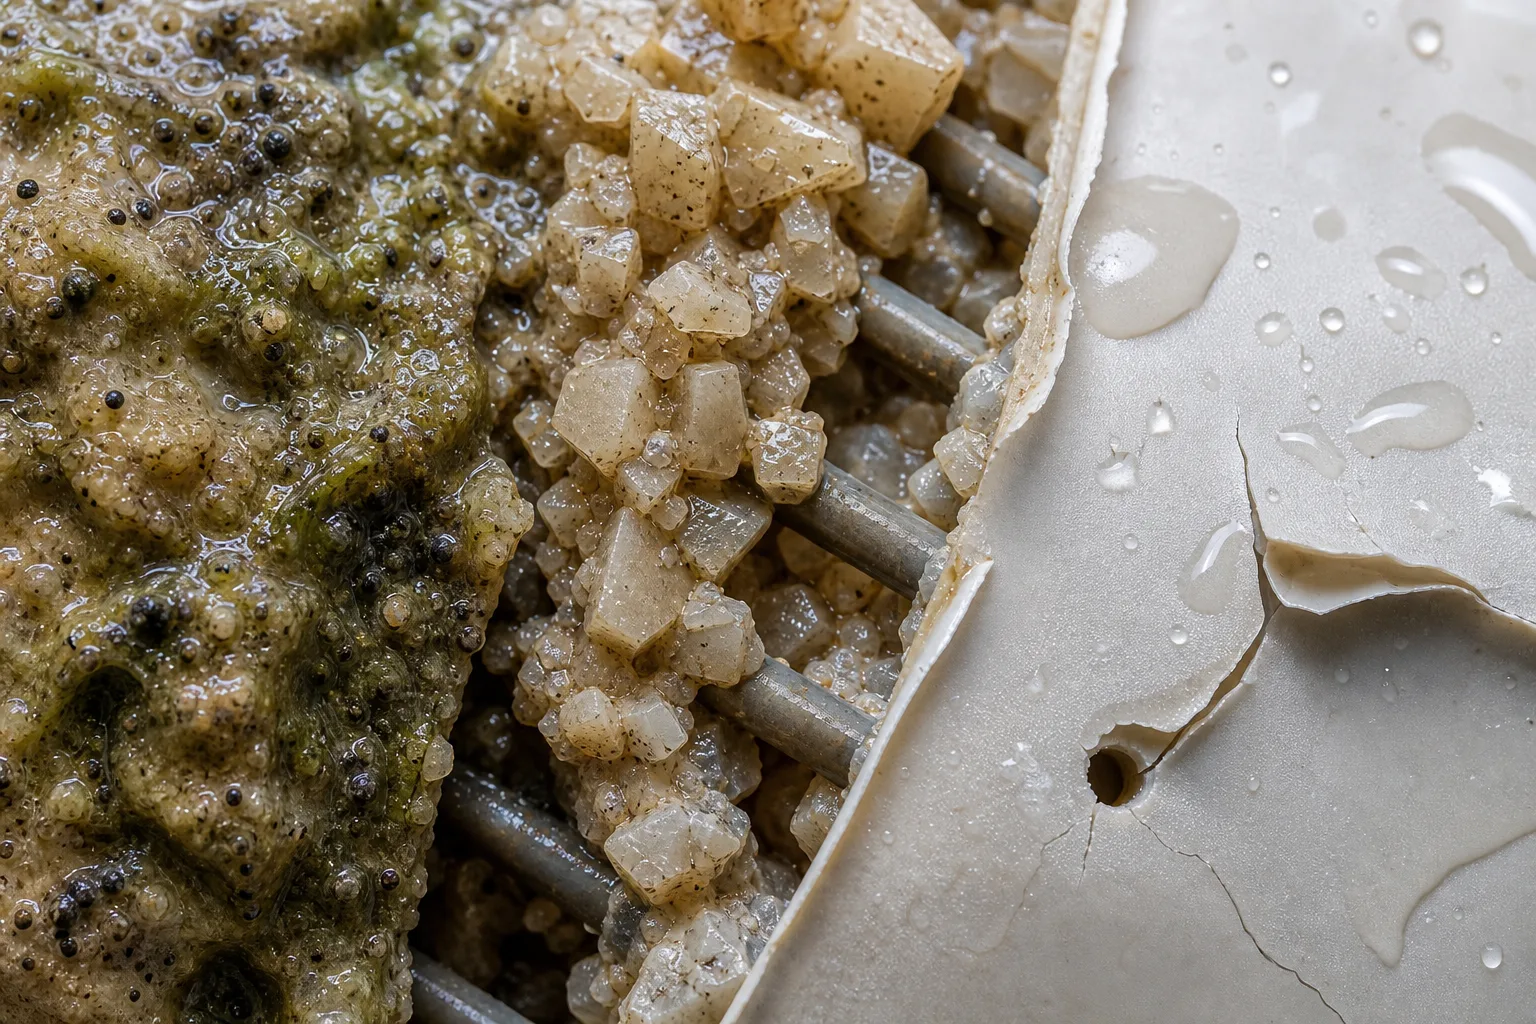 11Sticky mixed foulant22Faceted mineral scale33Sheet crack44Local hole or delamination
What to identify
- 1Sticky mixed foulant
- 2Faceted mineral scale
- 3Sheet crack
- 4Local hole or delamination
What the image proves
Fouling and scaling add deposits and resistance; damage removes barrier continuity and more directly raises salt passage. Color alone cannot substitute for mechanism.
How to verify on site
Use targeted TOC/ignition, ATP/microbiology, elemental/ion/XRD tests for deposits, and dye, microscopy, rejection or material tests for the sheet, with a clean reference.
Location through the array often carries more information than color
The cutaway vessels show deposits along the flow path: a dark lead-end layer supports incoming particulate/biofouling, while pale crystals near the concentrated end support scaling.
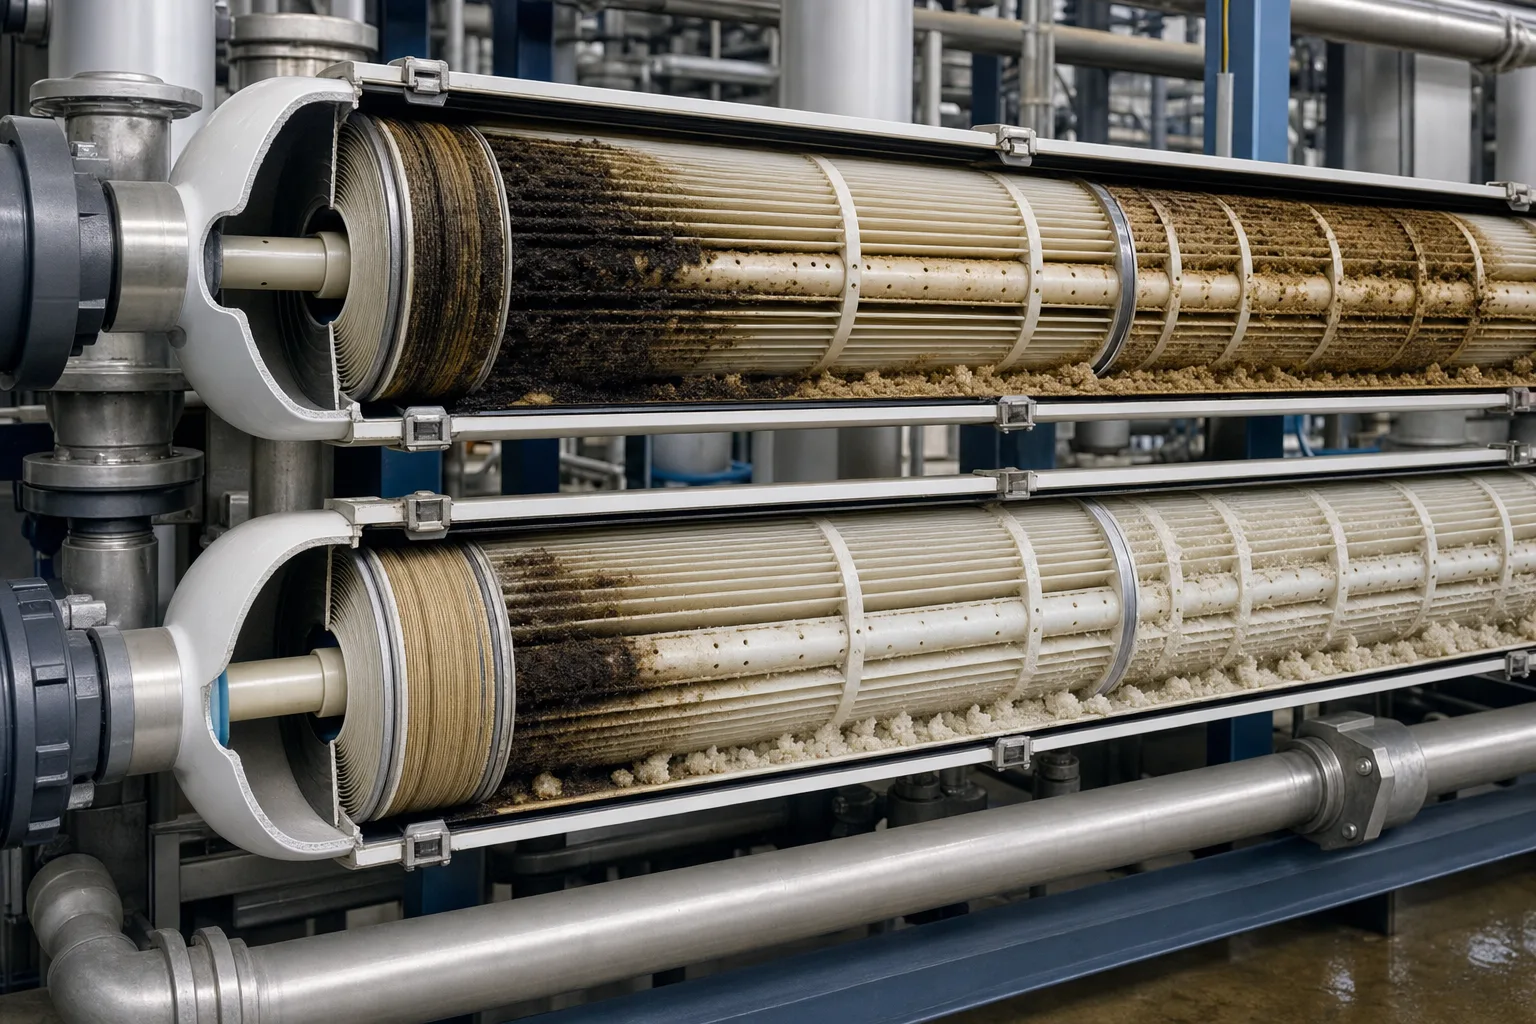 11High-solids feed end22Dark lead-stage deposit33High-saturation concentrate end44Pale tail-end crystals
What to identify
- 1High-solids feed end
- 2Dark lead-stage deposit
- 3High-saturation concentrate end
- 4Pale tail-end crystals
What the image proves
Lead-stage fouling and tail-stage scaling are useful patterns, not absolute rules. Recovery, flow maldistribution, shutdown flushing and pretreatment failures can shift the distribution.
How to verify on site
Trend stage pressures, flows and conductivity; probe vessel permeate and align the heaviest deposit with SDI, recovery and saturation history.
The same low production can come from different mechanisms
The left loop carries turbid feed and hydraulic resistance, the middle shows precipitation, and the right looks clean. Pressure, flow and permeate samples must be read together.
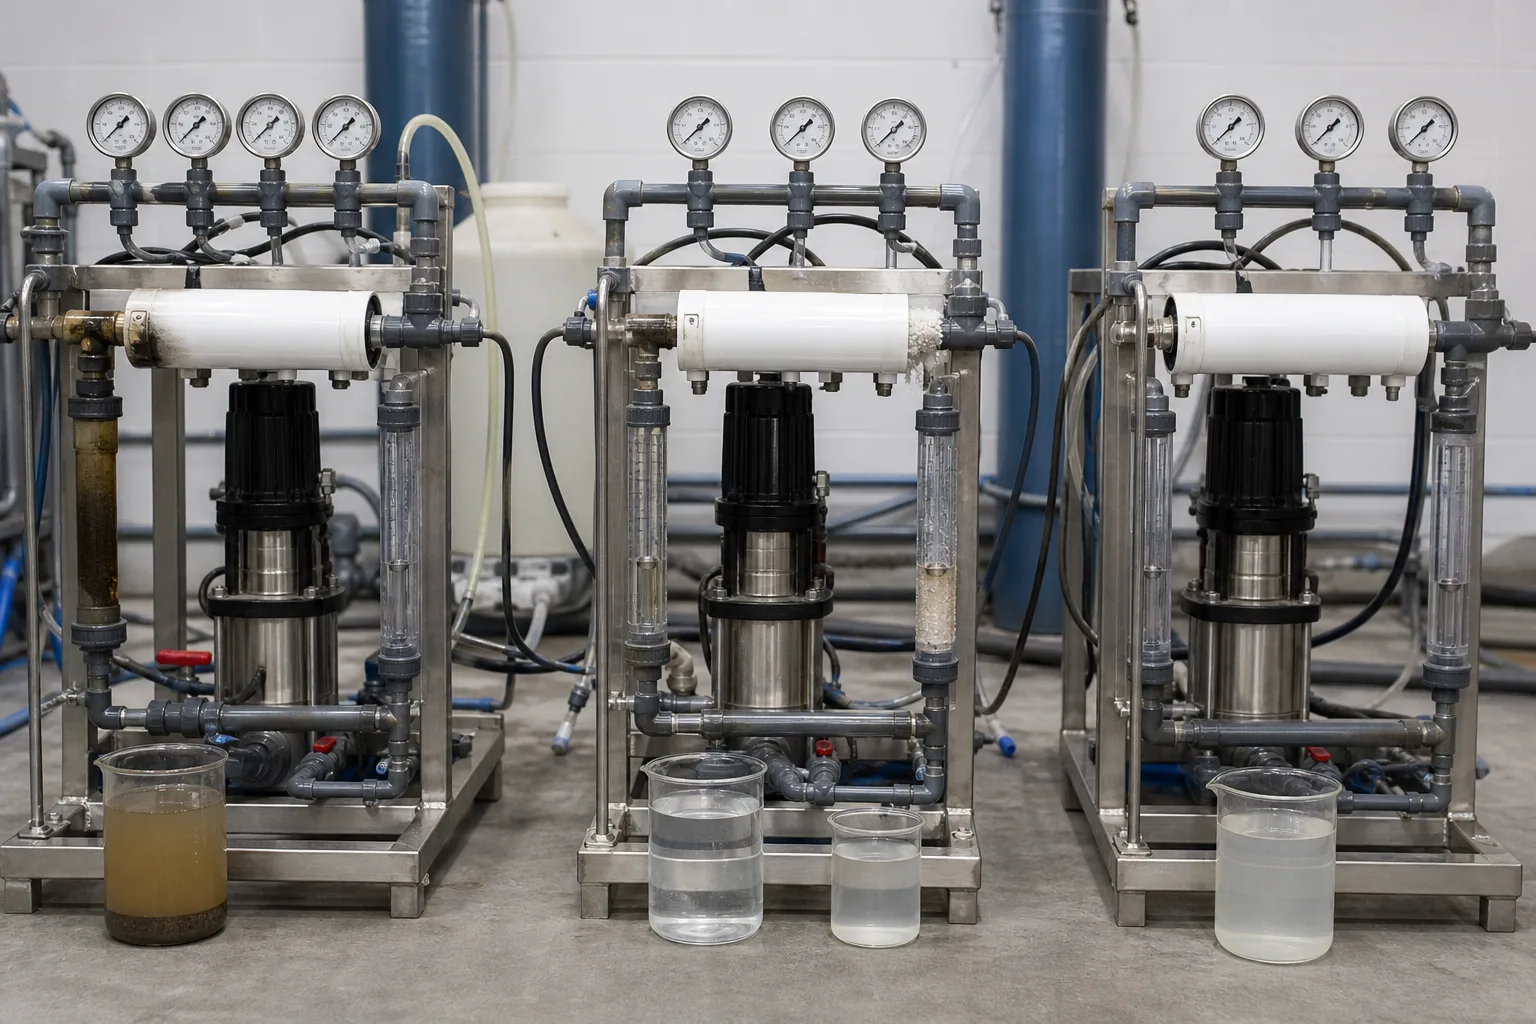 11Turbid feed load22Precipitating scale loop33Clean-looking comparison loop44Pressure, flow and permeate samples
What to identify
- 1Turbid feed load
- 2Precipitating scale loop
- 3Clean-looking comparison loop
- 4Pressure, flow and permeate samples
What the image proves
Pressure-drop growth points toward channel plugging; normalized flow loss can follow fouling or scale; salt-passage growth also requires checks for material damage and bypass. One KPI cannot assign cause.
How to verify on site
Under comparable standard conditions, compare pressure drop, normalized flow, salt passage and cleaning recovery, while validating pressure, flow, conductivity and temperature instruments.
Autopsy must connect evidence, not just produce photographs
The bench contains an opened feed spacer/membrane sheet, deposit sample, clean reference element and an end component with its seal under inspection.
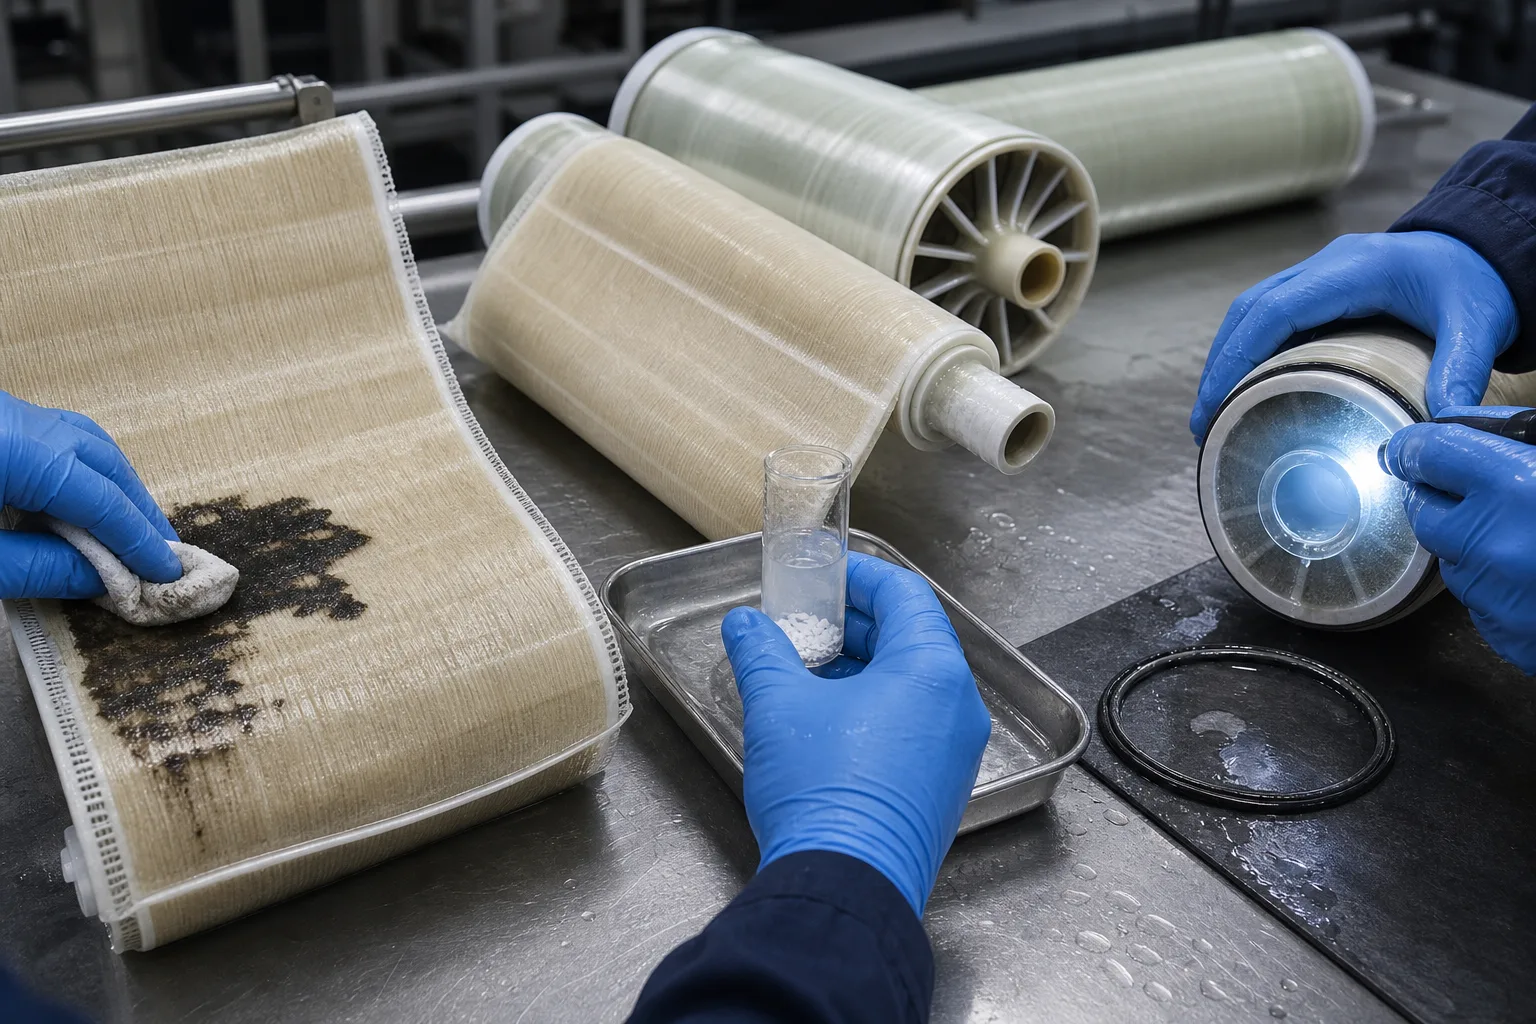 11Spacer and fouled sheet22Deposit sample33Clean reference element44End component and seal
What to identify
- 1Spacer and fouled sheet
- 2Deposit sample
- 3Clean reference element
- 4End component and seal
What the image proves
Deposits explain surface processes; seals, interconnectors, glue lines and product tubes explain bypass; trends and position explain when and where. Diagnosis closes only when all three agree.
How to verify on site
Before cutting, document appearance, weight, standard performance and seals. Sample by position, preserve chain of custody and reconcile results with pretreatment and operating events.
A six-step chain from alarm to root cause
Protect the evidence before choosing cleaning or destructive inspection.
1 Calibrate and normalize
Pressure/flow/conductivity/temperature → normalized trends
Remove false alarms caused by instruments and changing feed conditions.
2 Classify the symptom
ΔP↑ / flow↓ / salt passage↑
Separate channel resistance, productivity and selectivity/bypass problems.
3 Localize
Lead ↔ tail; array ↔ vessel ↔ element
Use spatial pattern to narrow solids, biology, scale and local integrity faults.
4 Identify material and component
Water + deposit + sheet + seals
Confirm deposit chemistry and inspect O-rings, connectors, tube and glue lines.
5 Test reversibility
Coupon clean / offline test / integrity test
Deposits may recover selectively; permanent damage will not recover by routine cleaning.
6 Close the root cause
Pretreatment/recovery/shutdown/assembly → correction
Correct the process that created the fault, not only the affected element.
Typical differences among four root-cause groups
Use these as starting hypotheses, never as one-signal verdicts.
Particulate/colloidal/organic/biofouling
- Mechanism
- Feed matter or biofilm coats the sheet and plugs the spacer
- Typical pattern
- Often starts in the lead stage; ΔP rises and normalized flow falls; targeted cleaning may recover
- Priority evidence
- SDI/turbidity/TOC/ATP, stage ΔP, deposit analysis, cleaning response
Mineral scaling
- Mechanism
- Concentrated ions exceed solubility and precipitate carbonate, sulfate, silica or metals
- Typical pattern
- Often heavier at the tail; flow and sometimes ΔP/salt passage change; recovery depends on scale and age
- Priority evidence
- Recovery, ion balance/saturation, elemental/XRD, dissolution or cleaning test
Chemical or sheet damage
- Mechanism
- Oxidant, extreme chemistry/temperature or stress alters the selective layer or sheet
- Typical pattern
- Salt passage persists after cleaning; visible damage may be absent
- Priority evidence
- Chemical event, normalized salt passage, coupon rejection/material analysis, location
Seal or connection bypass
- Mechanism
- O-ring, interconnector, end component, product tube or glue line bypasses the barrier
- Typical pattern
- Can be sudden and isolated to one vessel/element with little ΔP change
- Priority evidence
- Vessel probing, branch conductivity, component inspection, pressure/dye test
Manufacturer cleaning triggers are operating boundaries, not a root-cause diagnosis. Confirm instruments, pretreatment, recovery and location before selecting chemistry, pH, temperature, flow and time for the exact membrane and deposit.
Keep three traceable evidence sets
Normalized performance trends
Store stage normalized flow, salt passage and pressure drop with temperature, feed salinity, pressure, flow and recovery, including event history.
Feed and concentrate chemistry
Retain SDI/turbidity, TOC/biology, hardness, alkalinity, sulfate, silica, metals and antiscalant information to explain source and saturation risk.
Position and integrity records
Maintain vessel/element IDs, branch permeate conductivity, pre/post-cleaning results, replacements and seal work so anomalies map to components.
Where should each signal combination lead?
- Signal combination
- Lead-stage ΔP rises while normalized flow falls
- First suspicion
- Particulate/colloidal plugging or early biofouling
- Next action
- Check SDI, cartridge filters and pretreatment events; localize and analyze deposits before cleaning
- Signal combination
- Tail-stage flow falls with high recovery or rising saturation risk
- First suspicion
- Carbonate, sulfate, silica or metal scale
- Next action
- Recalculate ion balance, pH, temperature, antiscalant and recovery; sample tail deposits
- Signal combination
- Salt passage jumps in one vessel with little ΔP change
- First suspicion
- O-ring, connector, tube, glue-line bypass or local sheet damage
- Next action
- Probe branches, then inspect end parts and the individual element before system cleaning
- Signal combination
- Salt passage drifts up and does not recover after cleaning after an oxidant/extreme chemistry event
- First suspicion
- Irreversible selective-layer damage or aging
- Next action
- Reconstruct the event, test element/coupon rejection and material, replace if needed and repair chemical control
Four common misdiagnoses
Black means biofilm; white means calcium carbonate
Color is not unique. Organics, metals, chemicals and mixed deposits change appearance; composition testing is required.
Low flow means clean immediately
Temperature, pressure, salinity, recovery and instruments also change raw flow. Normalize and localize first.
Improvement after cleaning proves fouling only
A mixed fault may recover flow but retain salt passage from a damaged sheet or seal; compare all three KPIs.
High permeate conductivity proves a bad membrane sheet
Feed salinity, temperature, recovery, bypass and analyzer drift can look identical; branch and integrity evidence is required.