Illustrated guides · Biological treatment
How is ammonia converted step by step to nitrate?
Nitrification does not remove nitrogen. Under aerobic conditions it oxidizes ammonia first to nitrite and then to nitrate through different functional groups, consuming oxygen and alkalinity and requiring enough SRT. Nitrate needs a later removal path such as denitrification.
Direct answer
Direct answer
Ammonia nitrogen exists mainly as the NH₄⁺/NH₃ pair in water. Ammonia-oxidizing organisms (AOB/AOA) first use oxygen to form NO₂⁻-N and release acidity; nitrite-oxidizing bacteria (NOB) then oxidize NO₂⁻-N to NO₃⁻-N. Classical stoichiometry requires about 4.57 g O₂ and consumes about 7.14 g alkalinity as CaCO₃ per g NH₄-N fully nitrified. Nitrifiers grow slowly, so low temperature, inadequate SRT, low DO/alkalinity or inhibition often appears first as ammonia or nitrite breakthrough. Conversion to nitrate changes nitrogen form but does not remove total nitrogen; denitrification to N₂ or another explicit nitrogen sink is still required.
Four conditions must support both steps
Aeration or one ammonia result alone does not prove a stable nitrification chain.
Usable dissolved oxygen
Both oxidation steps need oxygen. Average basin DO can look adequate while upstream flocs remain transfer-limited, so compare zoned DO with ammonia and nitrite.
SRT longer than nitrifier growth needs
Nitrifiers grow more slowly than most heterotrophs and slow further in cold water. Excess wasting or solids loss can wash them out even when HRT is unchanged.
pH and alkalinity buffer acid production
Ammonia oxidation releases H⁺ and consumes alkalinity. Insufficient buffering lets the reaction depress pH and then inhibit itself.
Temperature, toxicity and competition remain controlled
Cold water slows kinetics; free ammonia, free nitrous acid and industrial toxicants may selectively inhibit groups, while high BOD competes for oxygen and space.
Full-scale nitrification occurs in aerated mixed liquor
Compartmented basins show bubbles, mixed-liquor circulation, air headers, online instruments and downstream clarification—a retained-community process, not an instant reaction.
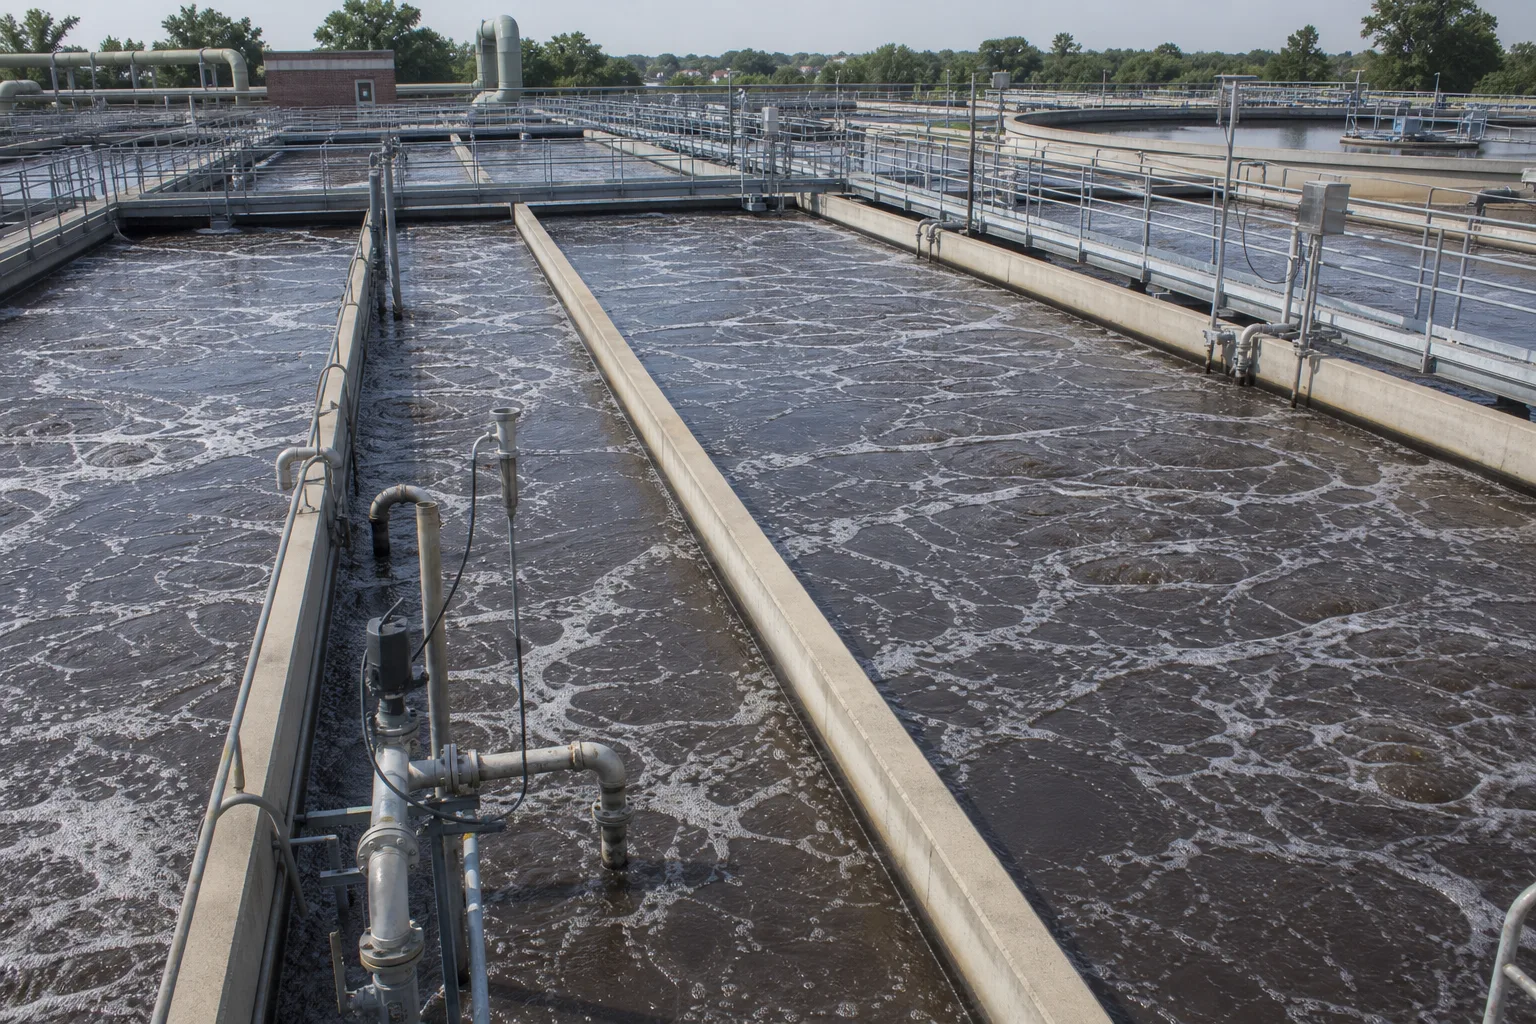 11High-ammonia upstream zone22Low-ammonia polishing zone33Air header and online probes44Clarifier and sludge return
What to identify
- 1High-ammonia upstream zone
- 2Low-ammonia polishing zone
- 3Air header and online probes
- 4Clarifier and sludge return
What the image proves
Oxygen demand and heterotrophic competition are usually greatest upstream. Downstream zones still need oxygen and time for NOB and residual ammonia oxidation, while clarification and return retain slow growers.
How to verify on site
Profile NH₄-N, NO₂-N, NO₃-N, DO, pH and alkalinity along the basin; verify airflow split, RAS/WAS, temperature and calculated SRT.
Two functional groups relay ammonia to nitrate
Two microbial populations in a floc matrix and different nitrogen molecules visualize the relay; molecular colors are explanatory, not microscopy identification.
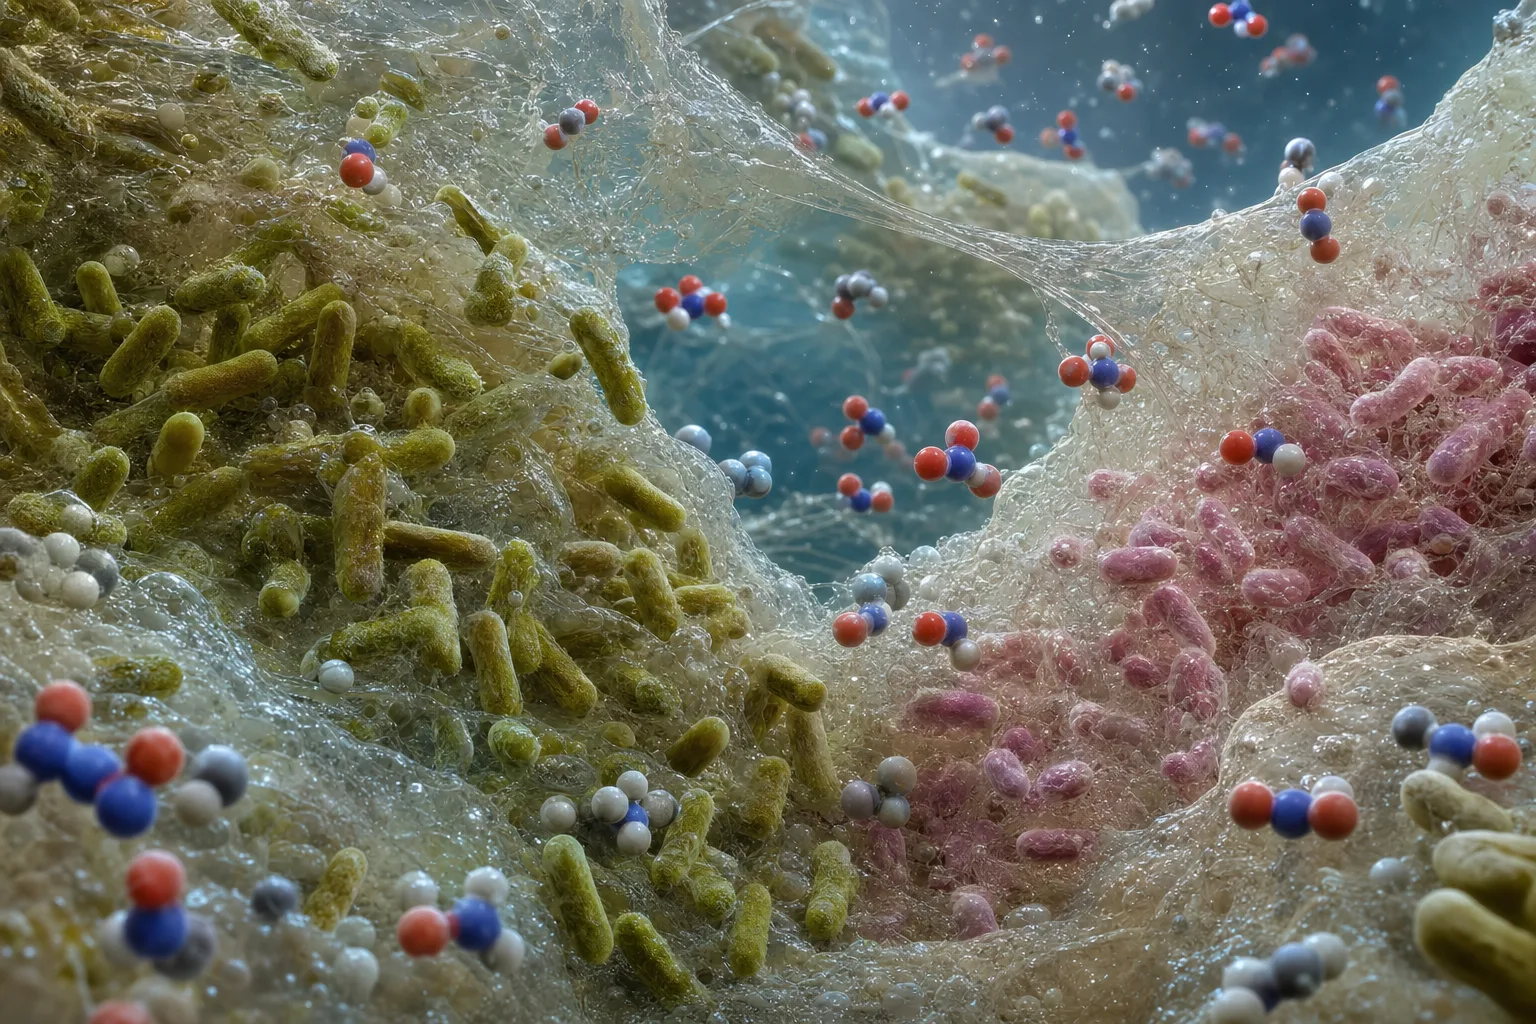 11Ammonia oxidizers AOB/AOA22Nitrite oxidizers NOB33Intermediate NO₂⁻44Oxidized product NO₃⁻
What to identify
- 1Ammonia oxidizers AOB/AOA
- 2Nitrite oxidizers NOB
- 3Intermediate NO₂⁻
- 4Oxidized product NO₃⁻
What the image proves
Step one forms nitrite and step two forms nitrate. A lag in either changes effluent speciation; nitrite accumulation proves the two rates are not synchronized.
How to verify on site
Measure NH₄-N, NO₂-N, NO₃-N and total inorganic nitrogen in the same sample set. Use activity or molecular tests—not ordinary microscopy—to confirm functional groups.
Serial zones separate high-load oxidation from polishing
Four connected aerated cells progress from dark mixed liquor to a clearer final zone. The image indicates a load gradient; color itself is not a nitrogen measurement.
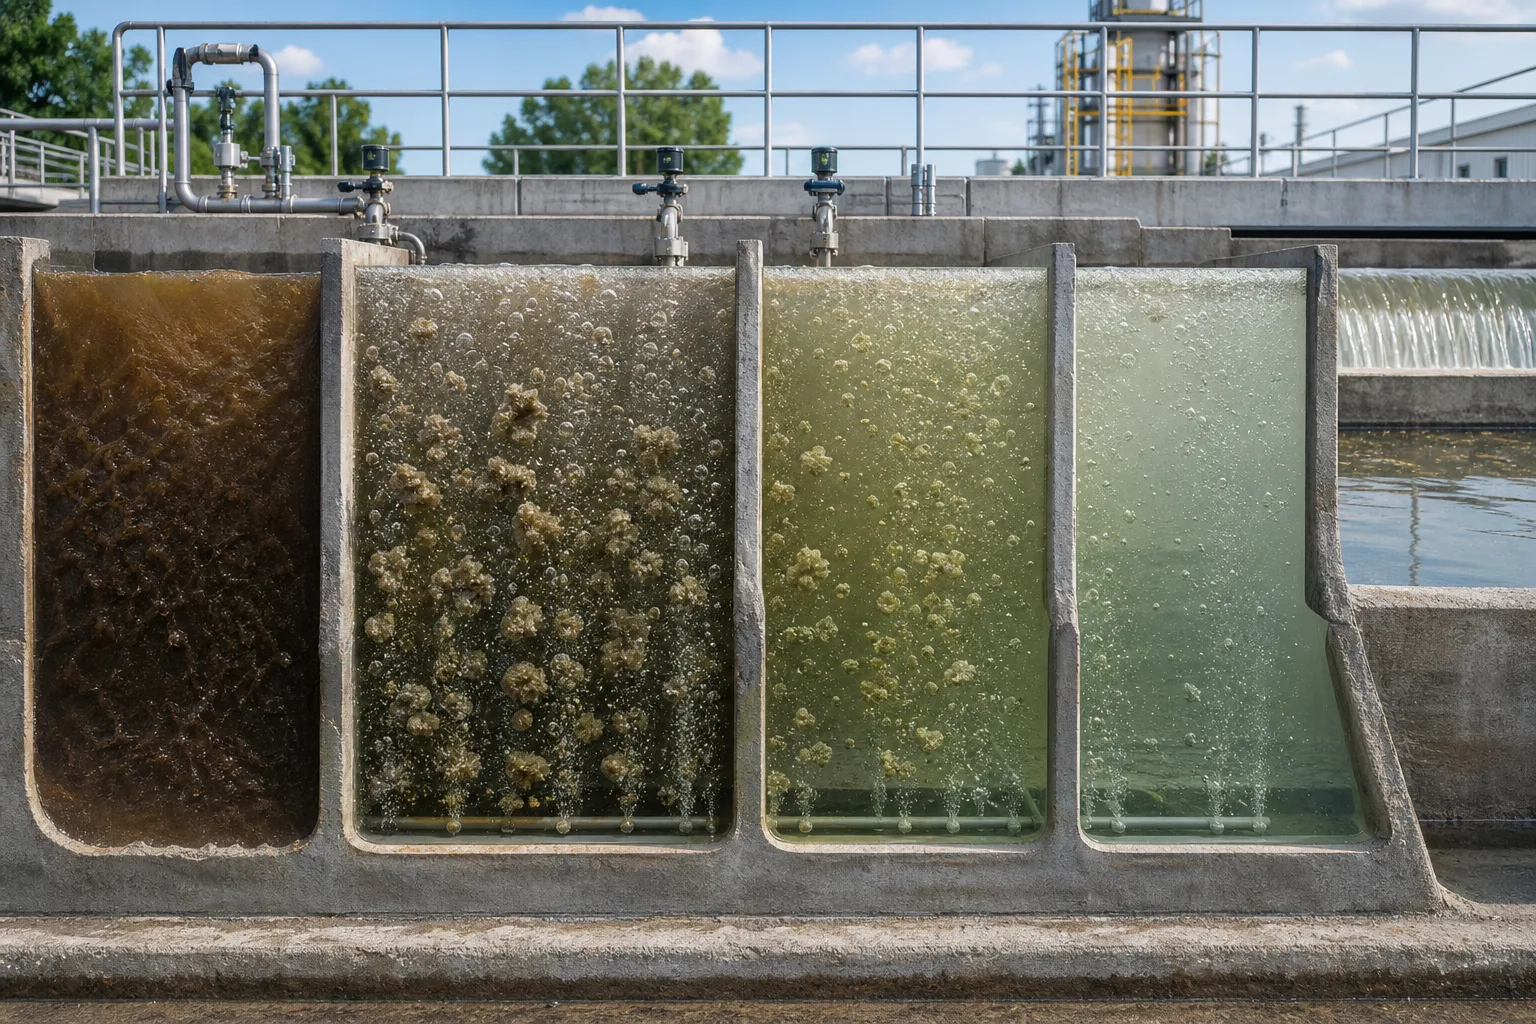 11Influent and return mixing22Main ammonia-oxidation zone33Nitrite-oxidation zone44Low-ammonia final zone
What to identify
- 1Influent and return mixing
- 2Main ammonia-oxidation zone
- 3Nitrite-oxidation zone
- 4Low-ammonia final zone
What the image proves
Falling ammonia with rising nitrate along the train is strong process evidence, but recycle and dilution require a flow-based nitrogen balance.
How to verify on site
Build a steady-state profile including influent and recycle flows. If nitrite jumps after one zone, first verify local DO, pH, temperature and inhibition.
The same equipment can give complete, partial or failed nitrification
Parallel pilot reactors with independent aeration and probes plus settling samples allow comparison of complete nitrification, nitrite accumulation and washout/inhibition.
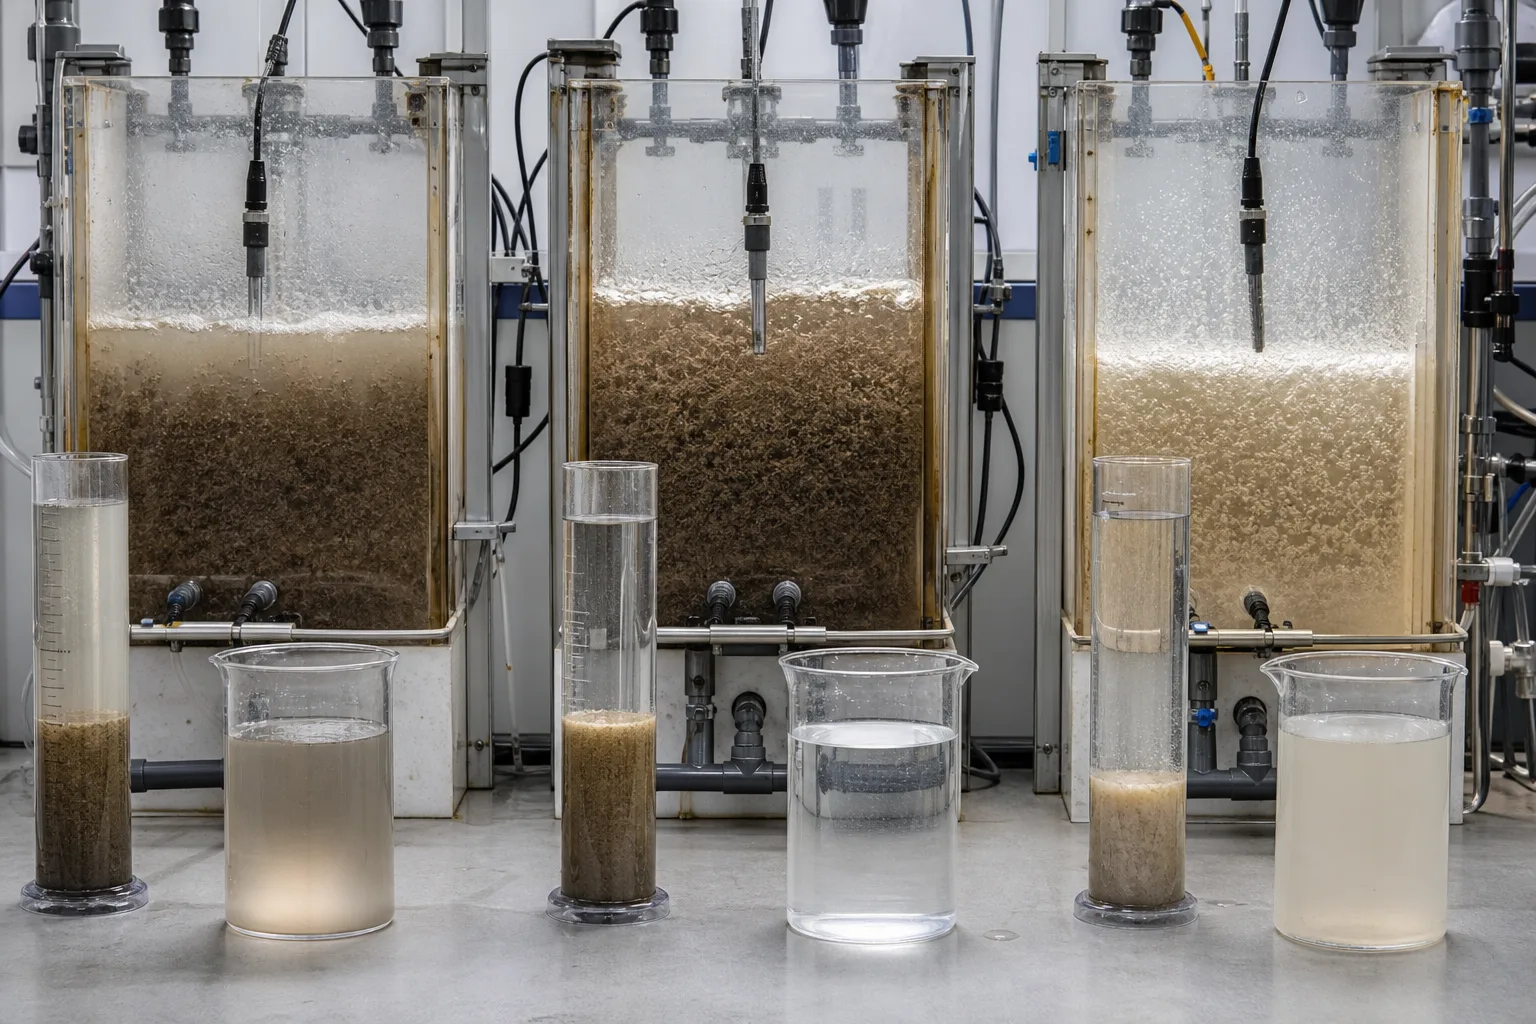 11Stable complete nitrification22Nitrite accumulation33Low-SRT or inhibited reactor44Settling samples and supernatant
What to identify
- 1Stable complete nitrification
- 2Nitrite accumulation
- 3Low-SRT or inhibited reactor
- 4Settling samples and supernatant
What the image proves
Low ammonia does not guarantee complete nitrification, and good settling does not guarantee nitrifier activity. Read all inorganic nitrogen forms with SRT and conditions.
How to verify on site
Keep temperature, pH, DO and starting ammonia comparable in batch tests; calculate ammonia- and nitrite-oxidation rates with blanks and controls.
Diagnosis puts nitrogen, alkalinity, DO and sludge on one timeline
Basin-side samples, sludge, microscope and online probes answer different questions about concentration, buffering, oxygen and biomass.
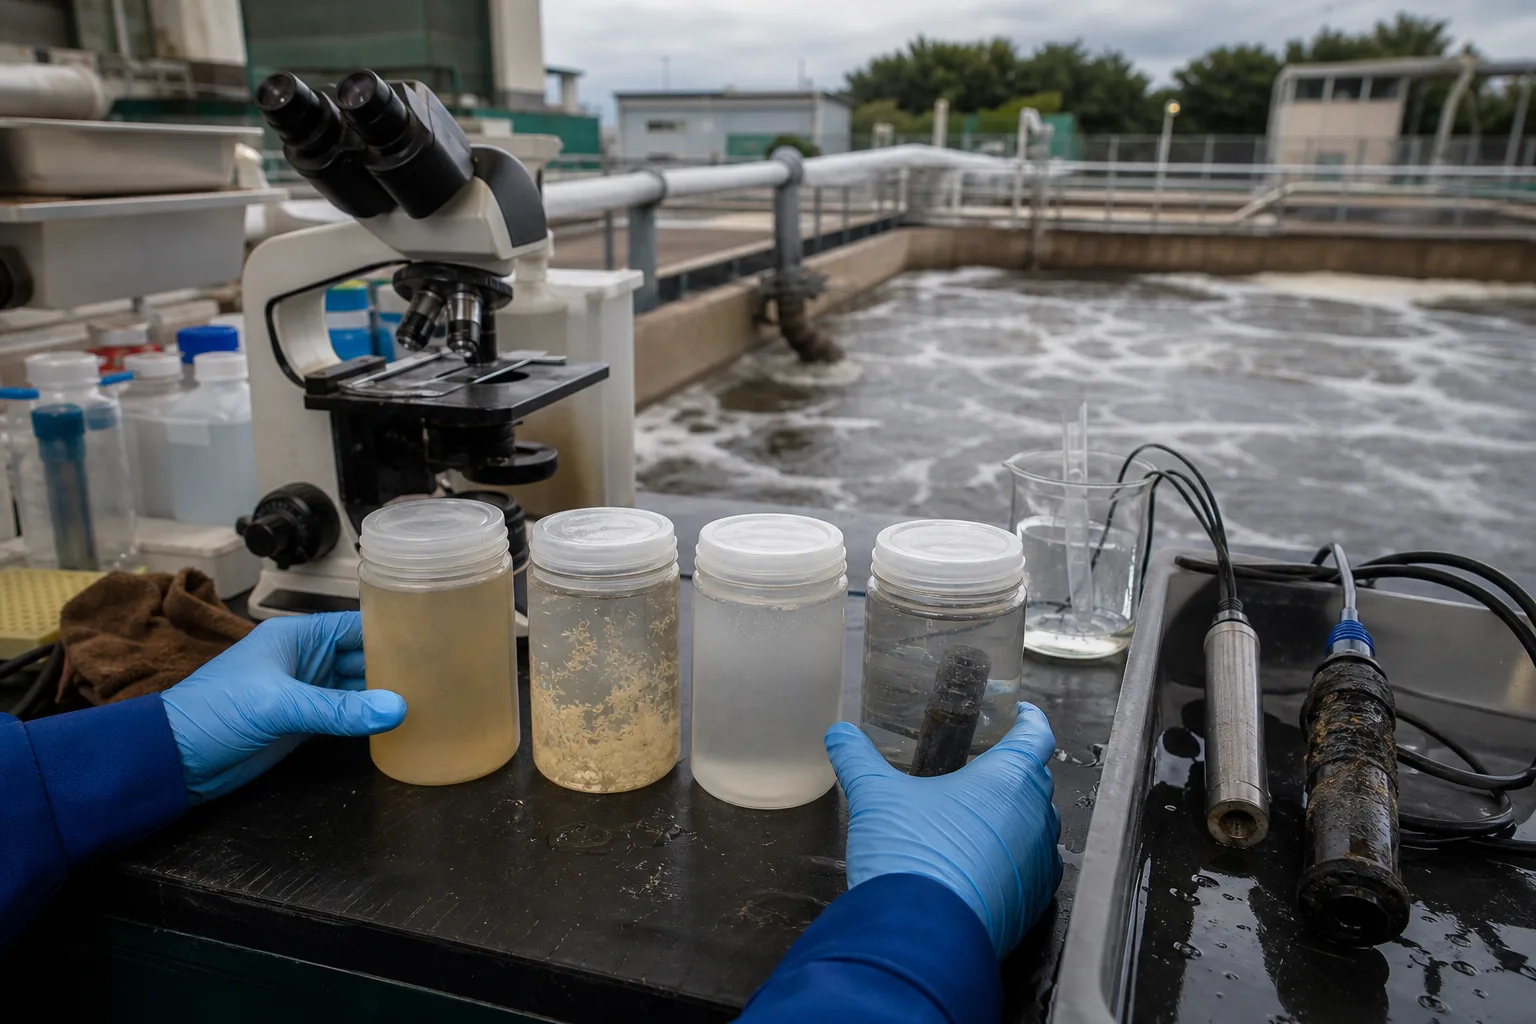 11Influent, zoned and effluent samples22Sludge and biomass sample33DO, pH and temperature probes44Microscopy and activity tests
What to identify
- 1Influent, zoned and effluent samples
- 2Sludge and biomass sample
- 3DO, pH and temperature probes
- 4Microscopy and activity tests
What the image proves
Failures compound: load raises oxygen demand, acid production consumes alkalinity, falling pH then slows nitrification. One final ammonia value cannot show that sequence.
How to verify on site
Align flow, NH₄/NO₂/NO₃-N, DO, pH, alkalinity, temperature, SRT, wasting and discharge events by hour or shift; verify analytical QC first.
Six steps from ammonia to nitrate
The path shows both biological oxidations and the oxygen, alkalinity and total-N boundaries.
1 Enter the water phase
Organic-N ammonification → NH₄⁺/NH₃
Create ammonia substrate available to oxidizers.
2 Transfer to biomass
Ammonia + O₂ → floc/biofilm
Deliver substrate and oxygen to slow-growing nitrifiers.
3 First oxidation
NH₄⁺ + 1.5O₂ → NO₂⁻ + 2H⁺ + H₂O
AOB/AOA gain energy and produce nitrite plus acidity.
4 Check the intermediate
NO₂-N formed ↔ consumed
Test whether the two rates are balanced.
5 Second oxidation
NO₂⁻ + 0.5O₂ → NO₃⁻
NOB oxidize nitrite to nitrate.
6 Define the next sink
NO₃-N → effluent or anoxic denitrification
Nitrification transforms; reduction to N₂ removes most nitrogen from water.
Who performs each task and what limits it?
Diagnose by function and process duty, not two memorized genus names.
AOB/AOA
- Function
- Oxidize ammonia to nitrite and generate acidity
- Main limitation
- Low DO, cold water, short SRT, low pH/alkalinity or toxicants
- Field evidence
- NH₄ loss, NO₂ formation, ammonia-oxidation rate and OUR profile
NOB
- Function
- Oxidize NO₂-N to NO₃-N
- Main limitation
- Low DO/temperature/SRT and selective free-ammonia or free-nitrous-acid inhibition
- Field evidence
- No nitrite buildup, nitrate gain and nitrite-oxidation rate
Heterotrophs and organic load
- Function
- Remove carbon while competing for oxygen and space
- Main limitation
- High BOD/COD demand crowds and oxygen-limits nitrifiers
- Field evidence
- BOD/COD, F/M, OUR and upstream DO/ammonia profile
Floc/biofilm and sludge recycle
- Function
- Retain slow-growing groups
- Main limitation
- Excess wasting, solids loss, shear or carrier loss lowers effective SRT
- Field evidence
- SRT, MLSS/MLVSS, RAS/WAS, blanket and carrier inventory
The classic two-step AOB/NOB model is useful for operation, but real systems can also contain AOA and complete ammonia oxidizers. Treat the model as a functional diagnostic framework, not a claim that only two fixed genera exist.
Track three evidence groups
Nitrogen forms and load
Influent, zoned and effluent NH₄-N, NO₂-N, NO₃-N, TKN/TN and flow show source, transformation and load removal.
Environment and theoretical demand
Zoned DO, pH, alkalinity, temperature, airflow and organic load can be checked against roughly 4.57 g O₂ and 7.14 g CaCO₃ per g NH₄-N.
Retention and abnormal events
SRT, MLSS/MLVSS, RAS/WAS, effluent TSS/blanket, specific rates and industrial events separate low biomass, low activity and bad measurements.
What do nitrogen-form combinations suggest?
- Signal combination
- High NH₄-N with low NO₂-N and NO₃-N
- First suspicion
- No effective first step: low SRT/DO/temperature/pH or inhibition
- Next action
- Verify true SRT, zoned DO, alkalinity/pH, temperature and toxic events; run an ammonia-oxidation activity test
- Signal combination
- Low NH₄-N but pronounced NO₂-N accumulation
- First suspicion
- NOB limitation, unless the process intentionally targets nitritation
- Next action
- Verify analyses, DO, pH/temperature, free ammonia/free nitrous acid and NOB activity; do not call it complete nitrification
- Signal combination
- NH₄-N rises gradually as water cools
- First suspicion
- Lower growth/rate with insufficient SRT safety margin
- Next action
- Recheck SRT and load versus temperature, reduce unnecessary wasting and secure oxygen/alkalinity; airflow alone cannot restore biomass
- Signal combination
- Nitrogen forms do not balance or swing implausibly
- First suspicion
- Sampling, preservation/filtration, analytical interference, recycle/batch timing or flow basis
- Next action
- Repeat synchronized QA-controlled samples and use mass loads, not isolated concentrations
Four misconceptions
Lower ammonia means total nitrogen removal
Nitrification mostly transfers NH₄-N to NO₃-N. Denitrification, sludge assimilation/wasting or another sink is still needed.
High DO guarantees nitrification
Oxygen cannot replace SRT, temperature, alkalinity or toxicity control; excess air wastes energy and can harm anoxic zones.
One nitrifying bacterium does everything
At least ammonia and nitrite oxidation are distinct functional steps, and the actual ecology is more complex.
Any nitrite is a failure
Accumulation warns of incomplete conventional nitrification, but shortcut nitrogen processes may intentionally retain nitrite; interpret against the design goal.