Illustrated guide · Industrial water systems
Where does a seawater desalination system use most of its energy?
Follow intake, pretreatment, high-pressure pumping, RO, isobaric recovery, post-treatment and delivery under one meter boundary to see why pressure is the core SWRO load and how recovery, losses and fouling change SEC.
Direct answer
Direct answer
The largest process electrical load in seawater reverse osmosis is usually the high-pressure section. Pumps must raise seawater above the membrane osmotic pressure while also covering channel, piping and equipment losses and maintaining target permeate flux. Higher salinity, lower temperature, greater concentration or higher resistance increases the required pressure and power. The RO membrane does not consume electricity directly; motors and pumps do. Membrane permeability, rejection, fouling and the selected flux/recovery determine the hydraulic duty. Concentrate leaves the membrane with substantial pressure energy. Isobaric exchangers or turbine devices return part of it to incoming seawater, so the main high-pressure pump supplies less flow or shaft power than a throttled-brine design. Intake/lift, pretreatment and backwash, cartridge filtration, booster/circulation pumps, CIP, post-treatment, concentrate discharge and product delivery also use energy. Specific energy consumption is the net electricity inside a declared boundary divided by qualified product volume (kWh/m³); state whether intake, pretreatment, post-treatment, auxiliaries, delivery, starts/CIP and off-spec water are included. Recovery is not simply maximized: it can reduce intake flow per product but raises brine salinity, average osmotic pressure, scaling and tail-element duty. Lower SEC comes from minimizing unnecessary pressure loss, maintaining normalized membrane performance, high-efficiency pumps/motors and appropriate speed control, keeping ERD flow/pressure/mixing within design, and reducing bypass, leakage and off-spec production. Compare plants only after aligning meter boundary, feed salinity/temperature, recovery, water quality and utilization.
Four boundaries are required before locating energy
Nameplate power, instantaneous kW and whole-plant SEC answer different questions.
Pressure exceeds osmotic pressure plus every loss
Osmotic pressure rises along the concentrating array; pretreatment, piping, feed spacers, ERD and permeate backpressure also consume net driving pressure.
ERD recovers brine pressure, not salt or free electricity
An isobaric device transfers pressure to fresh feed and a booster replaces losses; turbines recover shaft work. Efficiency, mixing, leakage, DP and availability matter.
The SEC denominator is qualified delivered water
Flushes, CIP, off-spec diversion and low-load operation use power without useful product. Design capacity is not an honest denominator.
Low-pressure high-flow equipment belongs in the plant boundary
Intake, pretreatment, backwash, post-treatment and delivery may have lower head but larger flow or elevation duty.
A full-scale SWRO plant exposes intake/pretreatment, high-pressure pumps, ERD path and RO racks
Low-pressure treatment feeds rows of blue high-pressure motors and pumps; white vessels separate water, while brine recovery/booster piping returns pressure to fresh seawater.
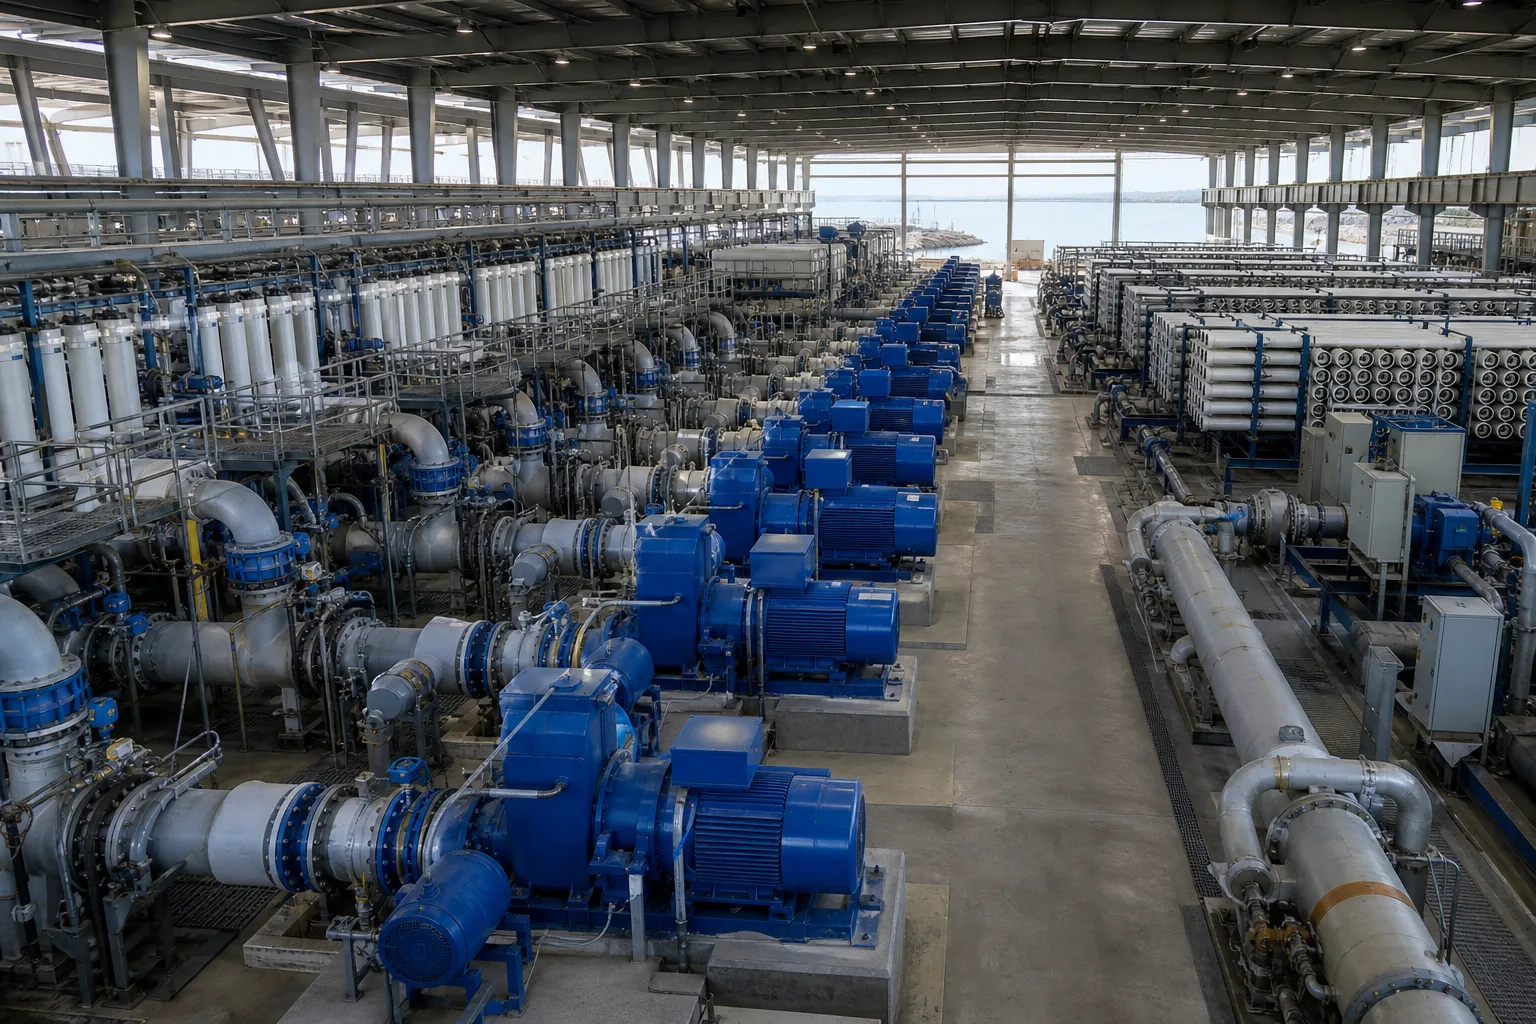 11Intake, pretreatment and low-pressure transport22Main high-pressure pump-motor trains33Isobaric ERD/booster and high-pressure brine44RO vessels, permeate and concentrate headers
What to identify
- 1Intake, pretreatment and low-pressure transport
- 2Main high-pressure pump-motor trains
- 3Isobaric ERD/booster and high-pressure brine
- 4RO vessels, permeate and concentrate headers
What this proves
The high-pressure train is usually the largest single load, but plant SEC is all metered energy divided by qualified product. ERD lowers grid duty; it does not eliminate membrane pressure.
Field check
Map electrical one-line to the P&ID and submeter intake, pretreatment, HP, ERD booster, post-treatment and delivery while logging flow, pressure, quality and bypass.
Field electrical, flow and pressure checks connect motor input to pump hydraulic output
A technician measures three-phase current at a large motor; the pump, smaller auxiliaries, meters and RO rack define the real hydraulic duty.
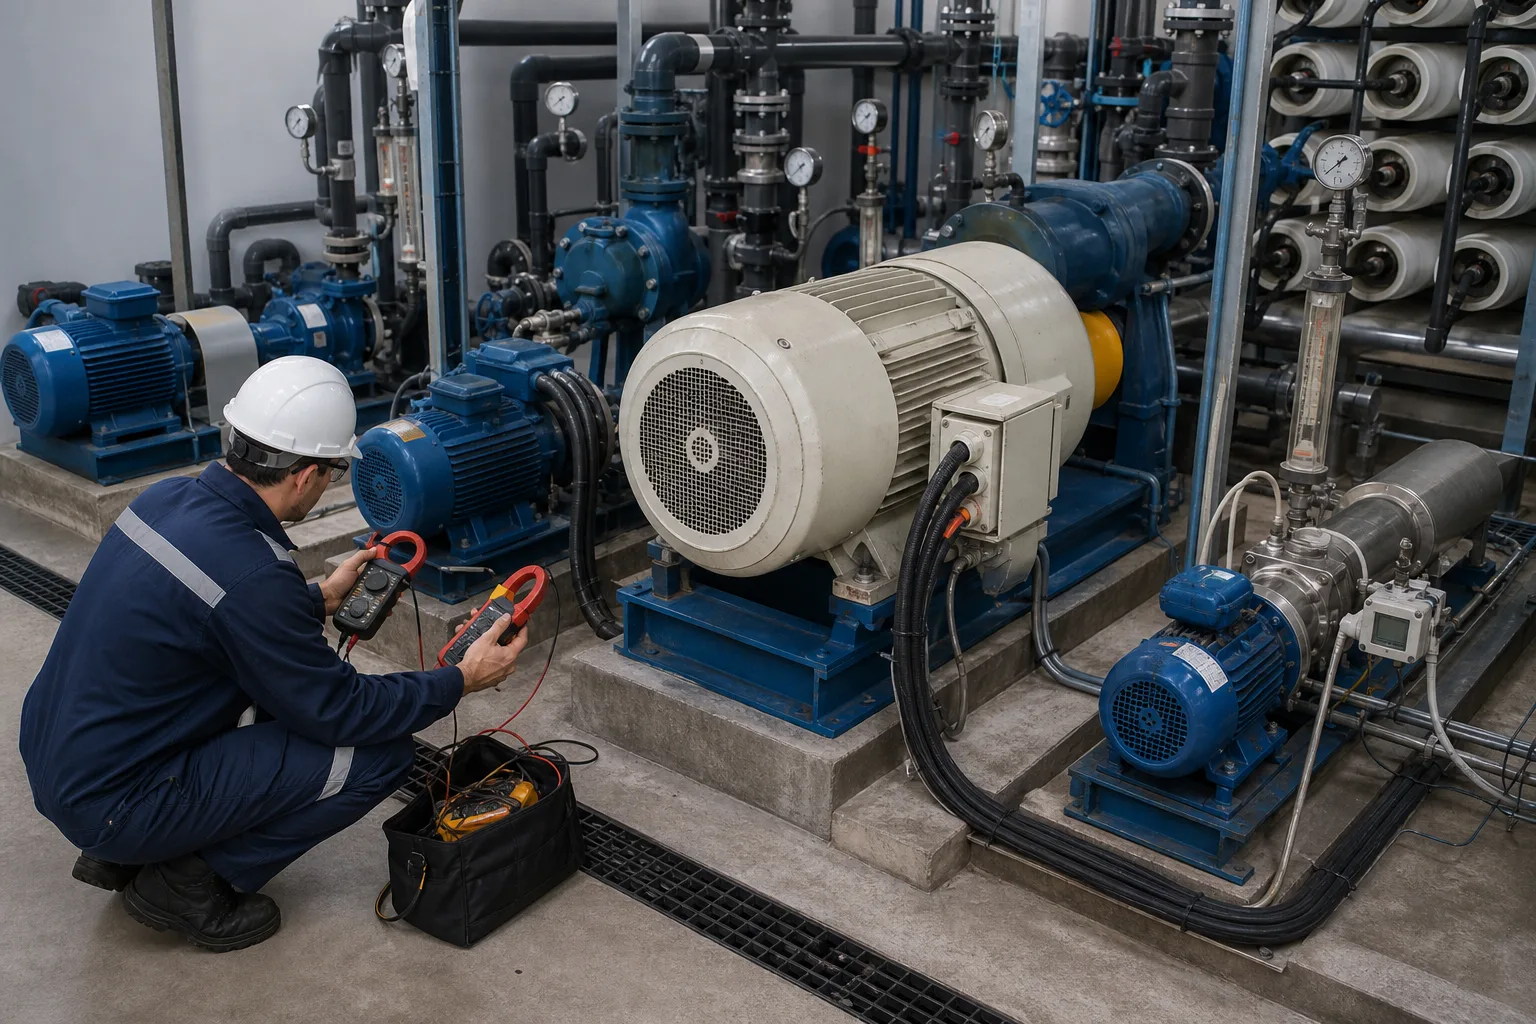 11Three-phase current, voltage and power factor22Main HP motor, coupling and pump33Booster/low-pressure pump and flow-pressure meters44RO rack flow and backpressure load
What to identify
- 1Three-phase current, voltage and power factor
- 2Main HP motor, coupling and pump
- 3Booster/low-pressure pump and flow-pressure meters
- 4RO rack flow and backpressure load
What this proves
Electrical input becomes QΔP only after motor and pump efficiency. High current may mean more flow/head, poor efficiency, mechanical trouble or phase imbalance.
Field check
Qualified staff should measure true three-phase power, not one current. Simultaneously capture suction/discharge P, flow, speed/VFD, vibration/T and valve position against the pump curve/BEP.
A compact skid shows low-pressure feed, guard filters, HP pump, RO array and control power
Feed pump/filters add pretreatment loss, a vertical multistage pump creates membrane pressure, white vessels split permeate/brine, and controls/auxiliary pumps regulate operation; not every small skid has a visible ERD.
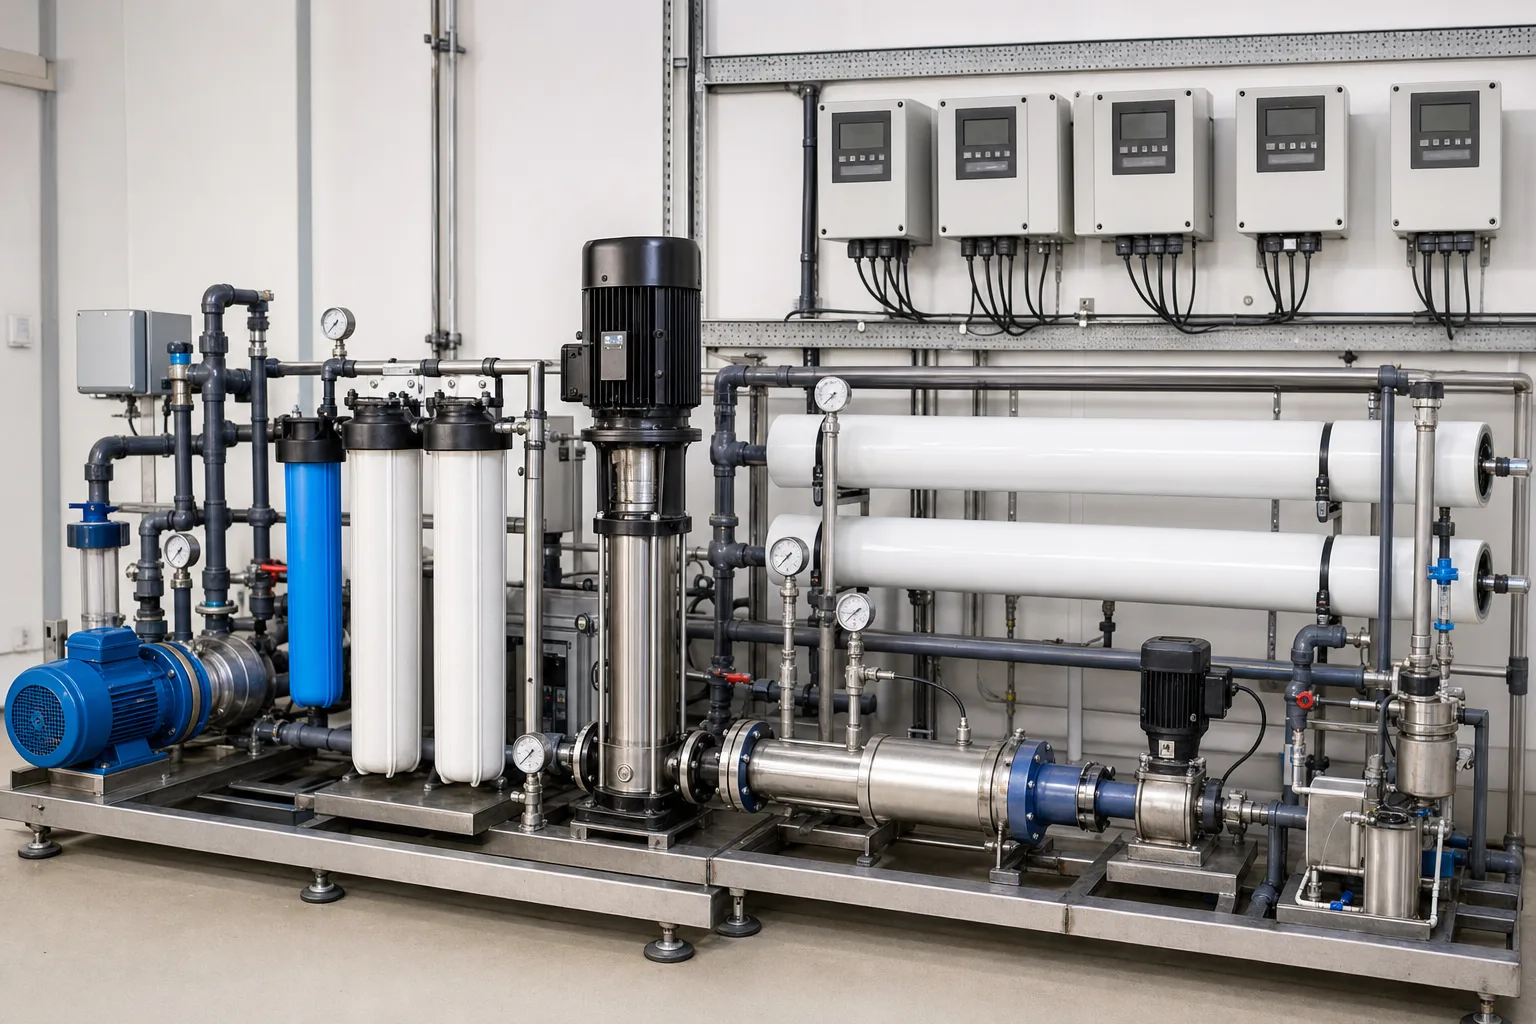 11Low-pressure feed pump and guard-filter loss22Vertical HP pump and pressure instruments33RO vessels with permeate/brine split44VFD controls, auxiliary pump and instruments
What to identify
- 1Low-pressure feed pump and guard-filter loss
- 2Vertical HP pump and pressure instruments
- 3RO vessels with permeate/brine split
- 4VFD controls, auxiliary pump and instruments
What this proves
Without ERD, brine pressure is throttled away. Whether recovery is economic depends on pressure, scale and load, but the actual configuration must remain explicit in the balance.
Field check
Measure segment pressure loss and valve throttling, read real VFD kW/hours, and verify cartridge, membrane and permeate backpressure rather than treating a control percentage as power.
Three parallel cases compare clean baseline, pressure-flow optimization and fouled high-loss operation
Only cases with matched salinity, temperature, recovery and qualified product can be compared; visible fouling and cloudy samples represent resistance and quality risk.
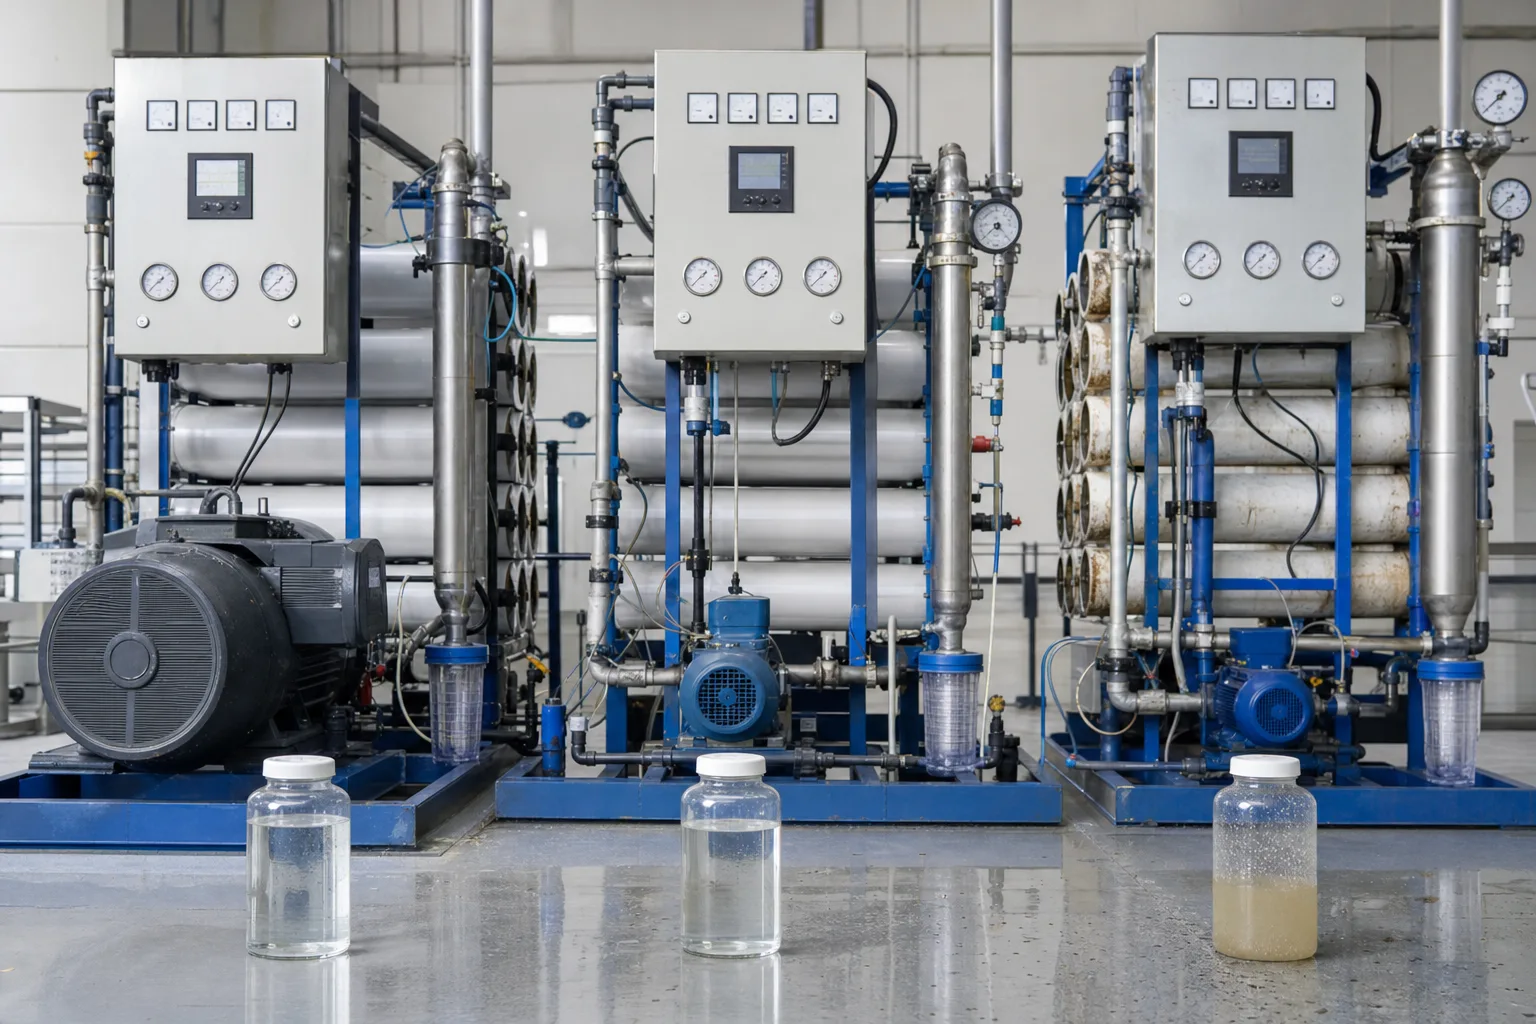 11Clean efficient pump-membrane baseline22VFD pressure-flow optimization case33Fouling/scale with DP and flux loss44Matched feed, qualified permeate and brine samples
What to identify
- 1Clean efficient pump-membrane baseline
- 2VFD pressure-flow optimization case
- 3Fouling/scale with DP and flux loss
- 4Matched feed, qualified permeate and brine samples
What this proves
Lower pressure is not a saving if product flow or quality falls. Fouling adds DP, reduces normalized flux and increases cleaning downtime.
Field check
At matched feed and quality, record net kW, flow, recovery, pressure, stage DP, salt passage and downtime; normalize membrane data before comparing pre/post cleaning SEC.
Field diagnosis combines pump/ERD pressure path, membrane racks and fouled cartridge evidence
Technicians read electrical and hydraulic data while cartridge surfaces show particle, biofilm, mineral and relatively clean conditions.
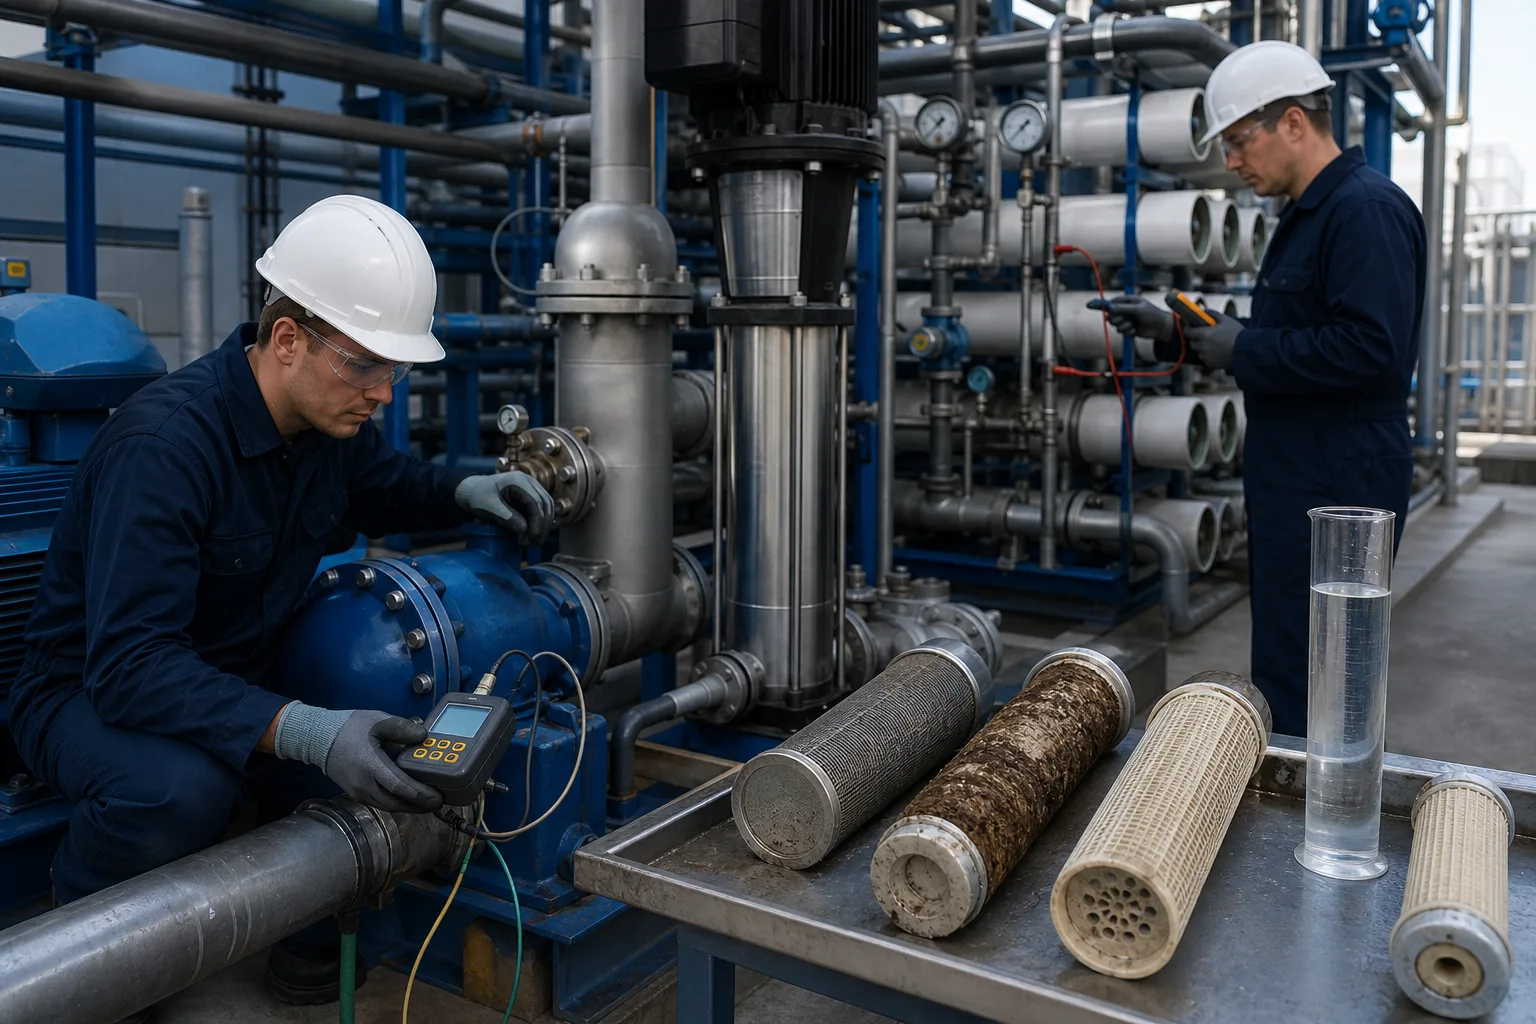 11HP pump/ERD connection and pressure boundary22Vertical booster or HP pump and instruments33RO vessels and high-pressure brine path44Cartridge foulant, branch samples and DP evidence
What to identify
- 1HP pump/ERD connection and pressure boundary
- 2Vertical booster or HP pump and instruments
- 3RO vessels and high-pressure brine path
- 4Cartridge foulant, branch samples and DP evidence
What this proves
An SEC increase is not automatically a membrane problem: guard-filter loss, pump efficiency, ERD mixing/leakage, throttling and permeate backpressure all add duty.
Field check
Build an intake-to-discharge pressure profile and submeter map; balance ERD port P/flow/salinity, pump efficiency and valves, analyze deposits by location, then verify SEC and quality after action.
Nine energy steps from sea to delivered water
Record flow and pressure at each step; brine energy counts only when transferred to a useful stream.
1 Intake/lift
Sea → screens/pumps/elevation
Move large flow against intake resistance and elevation.
2 Pretreatment
Coagulation/filter/UF/backwash/CIP
Protect RO while using pumps, air and cleaning energy.
3 Guard/feed
Pretreated water → cartridge → HP suction
Provide NPSH and low particulate load.
4 High-pressure work
Grid → motor → pump → seawater pressure
Exceed osmotic pressure and losses.
5 Membrane split
HP seawater → LP permeate + HP brine
Leave salt and much pressure in concentrate.
6 ERD/booster
HP brine → ERD → fresh feed; booster replaces loss
Reduce grid-supplied HP work.
7 Post-treatment
Permeate → remineralize/pH/disinfect/store
Meet stability and hygiene.
8 Discharge/delivery
LP brine → outfall; product → network elevation
Include real boundary and discharge duty.
9 SEC/availability
Net boundary kWh ÷ qualified delivered m³
Compare aligned quality and operating time.
Four energy functions have different loss locations
Separate hydraulic work, electrical loss, recovered pressure and membrane resistance.
Intake/pretreatment/delivery
- Primary role
- Move and treat high flow at lower pressure and overcome elevation
- Failure/boundary
- Clogging, frequent backwash, throttling, piping and head add product-specific duty
- Priority evidence
- Submeter kW, flow/segment DP, backwash/CIP/downtime and delivered product
HP pump-motor
- Primary role
- Convert electricity to QΔP above osmotic pressure and losses
- Failure/boundary
- Off-BEP, wear, cavitation, motor efficiency/power factor, bad speed/throttling
- Priority evidence
- True 3-phase kW, suction/discharge P, Q, speed, efficiency, vibration/T
RO array
- Primary role
- Create permeate/brine at net driving pressure without direct electrical load
- Failure/boundary
- Fouling/scale/aging/oxidation/backpressure change normalized flux, passage and stage DP
- Priority evidence
- Salinity/T/recovery, normalized flow/passage, stage DP and cleaning response
ERD-booster
- Primary role
- Transfer HP brine pressure to feed and replace device/piping losses
- Failure/boundary
- Mixing, leakage, DP, flow mismatch, air/particles, bypass or downtime reduces recovery
- Priority evidence
- Four-port flow/P/salinity, booster kW, efficiency/availability, bypass and system SEC
Always state the SEC boundary. RO-unit, in-plant treatment, plant-to-tank and long-distance delivery values are not directly comparable; feed salinity/temperature, recovery, product quality, scale and utilization also matter.
Four time-aligned energy records
Feed and production boundary
Intake salinity/T/turbidity, product quality, qualified product/brine/backwash volume, recovery and run/flush/CIP/off hours.
Pressure-flow profile
Every segment flow, suction/discharge P, valve, cartridge/stage DP, permeate backpressure and delivery elevation.
Electrical/rotating equipment
True 3-phase kW, VFD, power factor, motor/pump efficiency, speed, vibration/T, maintenance and parallel lineup.
Membrane/ERD outcome
Normalized flow/passage, stage DP, ERD port flow/P/salinity/mixing/leakage, booster kW and matched pre/post SEC.
Use power–pressure–flow–quality combinations
- Signal
- HP kW, feed pressure and stage DP rise while normalized permeate falls
- Priority hypothesis
- Pretreatment, cartridge or membrane fouling/scale adds resistance
- Next step
- Split cartridge/stage DP, normalize for salinity/T, analyze deposits, clean/replace by cause and verify SEC
- Signal
- HP hydraulic point is stable but input kW, vibration or temperature rises
- Priority hypothesis
- Off-BEP, impeller/seal/bearing wear, motor imbalance or coupling
- Next step
- Measure true power/efficiency and vibration/T/mechanics; do not hide the issue with throttling
- Signal
- Main-pump kW rises with abnormal ERD port DP, salinity mixing or flow ratio
- Priority hypothesis
- ERD bypass, mixing/leakage, clogging, air or mismatch reduces recovered pressure
- Next step
- Close four-port mass-salt-pressure balance and inspect valves/bypass/air/particles/wear; accept on system SEC
- Signal
- RO-unit SEC improves but plant or delivered-water SEC does not
- Priority hypothesis
- Intake/backwash/post-treatment/delivery, low load or off-spec diversion shifted the loss
- Next step
- Recalculate subsystem kWh per qualified delivered m³ at matched production and target the largest added load
Four common misconceptions
The RO membrane consumes electricity
Motors and pumps do; membrane osmotic/resistance/performance defines the hydraulic duty.
ERD makes the high-pressure pump unimportant
Main pump, booster and ERD matching together determine net power.
Higher recovery always lowers SEC
It raises brine osmotic pressure, scaling and tail-element duty; a system optimum exists.
One HP-pump meter equals plant SEC
Declare the boundary and include intake, pretreatment, auxiliaries, post-treatment, delivery and off-spec water.